Repairable Systems Analysis Reference Example: Difference between revisions

From ReliaWiki
Jump to navigation Jump to search
No edit summary
No edit summary
Line 60: Line 60:


::<math>\begin{align}
\hat{\beta }=&\frac{\sum_{q=1}^{K}N_{q}}{\sum_{q=1}^{K}\sum_{i=1}^{N_{q}}ln \left(\frac{T}{N_{iq}}\right)}\\
\hat{\beta }=&\frac{\sum_{q=1}^{K}N_{q}}{\sum_{q=1}^{K}\sum_{i=1}^{N_{q}}ln \left(\frac{T}{X_{iq}}\right)}\\
\\
\\
=&0.6153
=&0.6153
\end{align}\,\!</math>


Revision as of 22:19, 11 June 2014

RGA_Reference_Examples_Banner.png
RGA_Reference_Examples

This example compares the results for a repairable systems analysis.


Reference Case

Crow, L.H., Reliability Analysis for Complex Repairable Systems, Reliability and Biometry: Statistical Analysis of Lifelength, pg. 385, 1974.


Data

System 1 System 2 System 3
4.3 0.1 8.4
4.4 5.6 32.4
10.2 18.6 44.7
23.5 19.5 48.4
23.8 24.2 50.6
26.4 26.7 73.6
74 45.1 98.7
77.1 45.8 112.2
92.1 72.7 129.8
197.2 75.7 136
98.6 195.8
120.1
161.8
180.6
190.8
Simulated Data for 3 Systems with End Time = 200 hours


Result

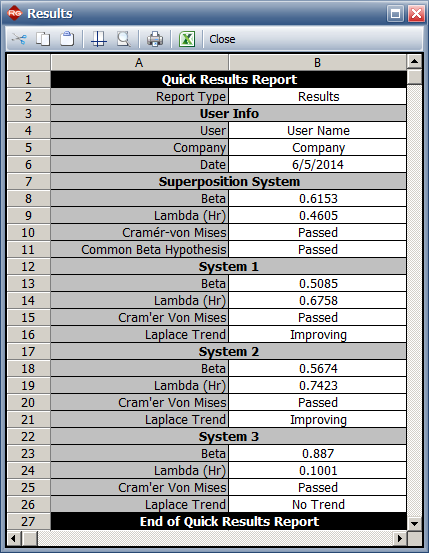
Beta = 0.615, Lambda = 0.461


Results in RGA

Since [math]\displaystyle{ \,\!S_{1}=S_{2}=S_{3}=0 }[/math] and [math]\displaystyle{ \,\!T_{1}=T_{2}=T_{3}=200 }[/math] then the maximum likelihood estimates of [math]\displaystyle{ \,\!\hat{\beta} }[/math] and [math]\displaystyle{ \,\!\hat{\lambda } }[/math] are given by:


[math]\displaystyle{ \begin{align} \hat{\beta }=&\frac{\sum_{q=1}^{K}N_{q}}{\sum_{q=1}^{K}\sum_{i=1}^{N_{q}}ln \left(\frac{T}{X_{iq}}\right)}\\ \\ =&0.6153 \end{align}\,\! }[/math]


[math]\displaystyle{ \begin{align} \hat{\lambda }=&\frac{\sum_{q=1}^{K}N_{q}}{KT^{\hat{\beta }}}\\ \\ =&0.4605 \end{align}\,\! }[/math]


Repairable SystemS SIAM Results.png