Webull++ Warranty Time to Failure Format with Plot Example
Warranty Data Analysis Times-to-Failure Format with Plot Example
There are several different folio formats in Warranty Analysis. The Times-to-Failure format is the simplest one. It is like the Weibull++ standard folio, but you can use it to generate forecast.
Assume we have the following information of a product.
Times-to-Failure Data:
| Number in State | State F or S | State End Time |
| 2 | F | 100 |
| 3 | F | 125 |
| 5 | F | 175 |
| 1500 | S | 200 |
Future Sales:
| Quantity In-Service | Time (Hr) |
| 500 | 200 |
| 400 | 300 |
| 100 | 500 |
We can use Warranty Analysis to analyze the above data and generate forecast for future returns.
Solution.
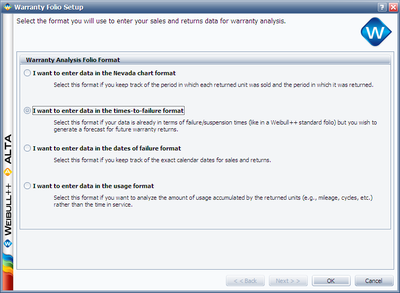
Step 1: Create a Warranty folio by selecting the I want to enter data in the times-to-failure format.
Step 2: Enter the above data into the Data and Future Sales sheet.
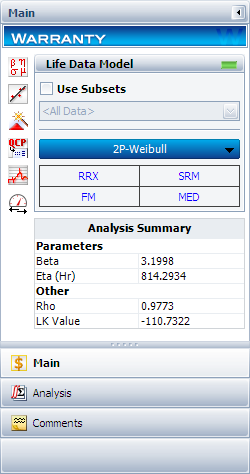
Step 3: Use the following setting to calculate the data. The results are:
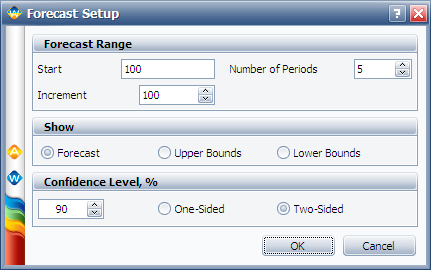
Step 4: Click on the Forecast button to get the following window.
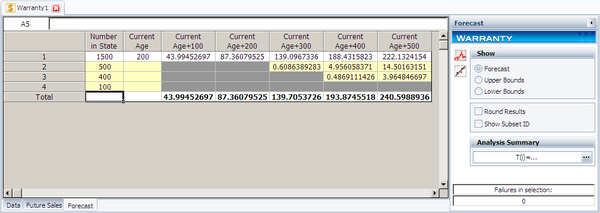
Click on OK. The predicted future returns are:
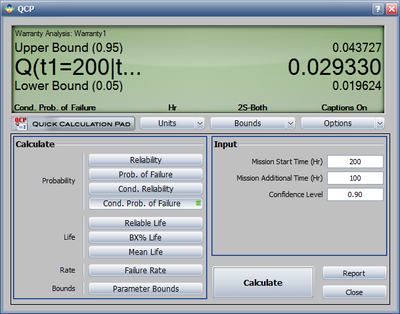
We will use the first row to explain how the forecast for each cell is calculated. For example, there are 1500 units with current age of 200. The probability of failure in next 100 hours can be calculated in QCP as:
Therefore, the predicted number of failures for the first 100 hours is:
- [math]\displaystyle{ 1500\times 0.02932968=43.99452 }[/math]
This is the same as the result given in the forecast folio (the 3rd cell in the first row) in Warranty analysis. The bounds and the values in other cells can be calculated similarly.
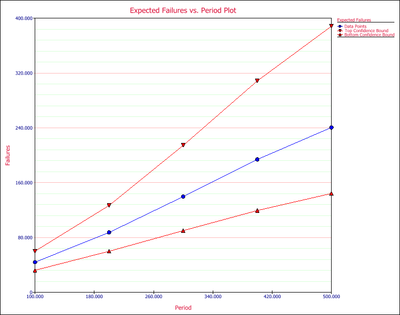
All the plots in the standard folio are available in Warranty Analysis, such as the probability plot, Reliability plot, etc. One additional plot in Warranty Analysis is the “Expected Failures” plot. It is given in below.
