Grouped Data - Crow Extended Example
Jump to navigation
Jump to search
 |
New format available! This reference is now available in a new format that offers faster page load, improved display for calculations and images and more targeted search.
As of January 2024, this Reliawiki page will not continue to be updated. Please update all links and bookmarks to the latest references at RGA examples and RGA reference examples.
This example appears in the Reliability growth reference.
A reliability growth test was conducted for 200 hours. Some of the corrective actions were applied during the test while others were delayed until after the test was completed. The tables below give the data set and the effectiveness factors for the BD modes. Do the following:
- Estimate the parameters of the Crow Extended model.
- Determine the average effectiveness factor of the BC modes using the Function Wizard.
- What percent of the failure intensity will be left in the system due to the BD modes after implementing the delayed fixes?
| Grouped Failure Times Data | |||
| Number at Event | Time to Event | Classification | Mode |
|---|---|---|---|
| 3 | 25 | BC | 1 |
| 1 | 25 | BD | 9 |
| 1 | 25 | BC | 2 |
| 1 | 50 | BD | 10 |
| 1 | 50 | BD | 11 |
| 1 | 75 | BD | 12 |
| 1 | 75 | BC | 3 |
| 2 | 75 | BD | 13 |
| 1 | 75 | A | |
| 1 | 100 | BC | 4 |
| 1 | 100 | BD | 14 |
| 1 | 125 | BD | 15 |
| 1 | 125 | A | |
| 1 | 125 | A | |
| 1 | 125 | BC | 5 |
| 1 | 125 | BD | 10 |
| 1 | 125 | BC | 6 |
| 1 | 150 | A | |
| 1 | 150 | BD | 16 |
| 1 | 175 | BC | 4 |
| 1 | 175 | BC | 8 |
| 1 | 175 | A | |
| 1 | 175 | BC | 7 |
| 1 | 200 | BD | 16 |
| 1 | 200 | BC | 3 |
| 1 | 200 | BD | 17 |
| Effectiveness Factors | |
| BD Mode | Effectiveness Factor |
|---|---|
| 9 | 0.75 |
| 10 | 0.5 |
| 11 | 0.9 |
| 12 | 0.6 |
| 13 | 0.8 |
| 14 | 0.8 |
| 15 | 0.25 |
| 16 | 0.75 |
| 17 | 0.8 |
Solution
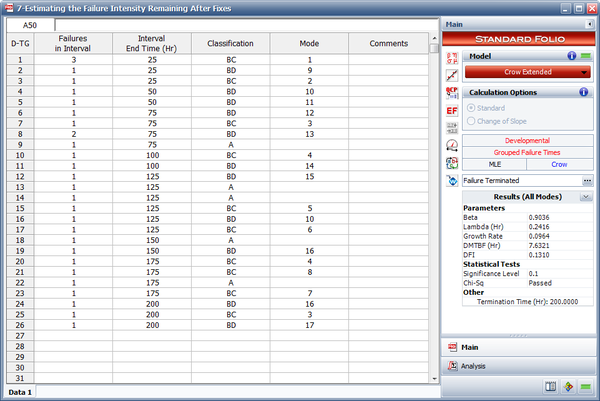
- The next figure shows the estimated parameters of the Crow Extended model.

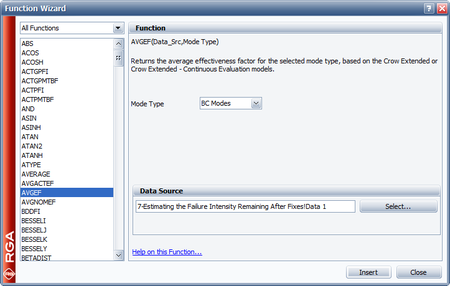
- Insert a general spreadsheet into the folio, and then access the Function Wizard. In the Function Wizard, select Average Effectiveness Factor from the list of available functions and under Avg. Eff. Factor select BC modes, as shown next. Click Insert and the result will be inserted into the general spreadsheet. The average effectiveness factor for the BC modes is 0.6983.

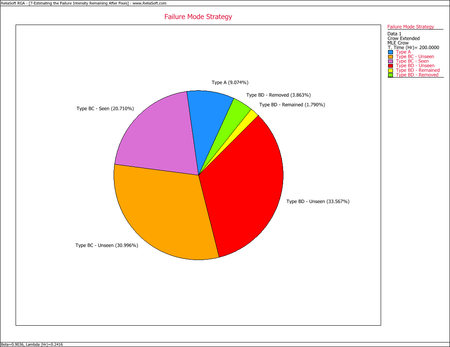
- The failure intensity left in the system due to the BD modes can be determined using the Failure Mode Strategy plot, as shown next. Therefore, the failure intensity left in the system due to the BD modes is 1.79%.
