BlockSim Analytical Fault Tree and RBD Plot Examples: Difference between revisions
Lisa Hacker (talk | contribs) No edit summary |
Lisa Hacker (talk | contribs) No edit summary |
||
| Line 4: | Line 4: | ||
[[Image:OR gate Results.png|thumb|center|400px|]] | [[Image:OR gate Results.png|thumb|center|400px|]] | ||
There are several plots available for analytic RBD and | There are several plots available for analytic RBD and fault tree analysis. | ||
At the system level, there are four plots available as shown in the following: | |||
=====Unreliability vs. Time===== | =====Unreliability vs. Time===== | ||
Revision as of 05:05, 26 July 2012
 |
New format available! This reference is now available in a new format that offers faster page load, improved display for calculations and images and more targeted search.
As of January 2024, this Reliawiki page will not continue to be updated. Please update all links and bookmarks to the latest references at BlockSim examples and BlockSim reference examples.
Let's assume that the three components A, B and C follow failure distributions Weibull(Beta=1.5,Eta=1000), Weibull(Beta=1.1, Eta=800) and Exponential(MTTF=3000). The reliability for each components and the system at mission time =100 hours is shown in the figure below.
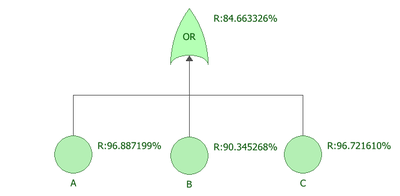
There are several plots available for analytic RBD and fault tree analysis. At the system level, there are four plots available as shown in the following:
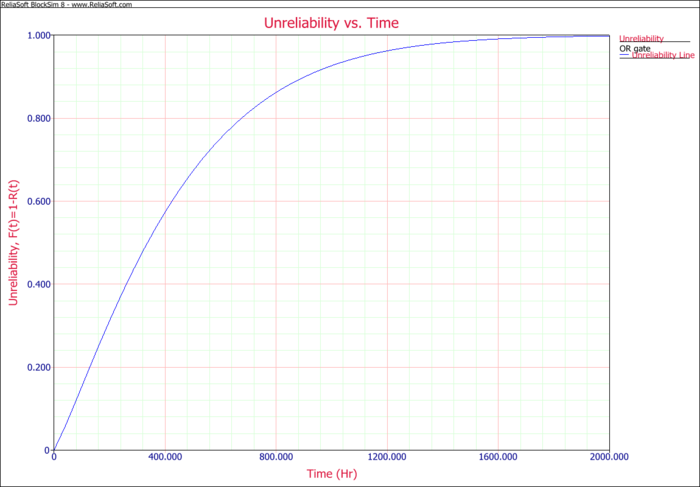
Unreliability vs. Time
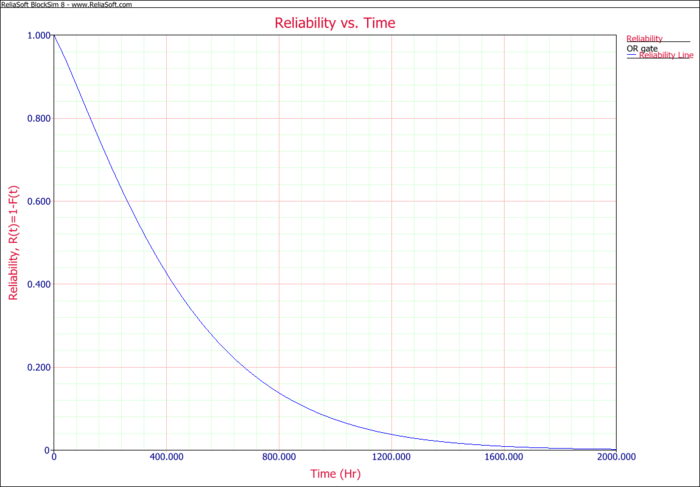
Reliability vs. Time
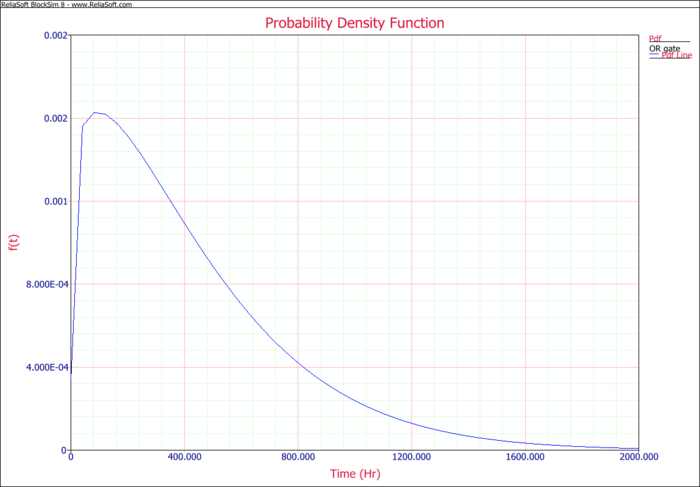
Probability Density Function
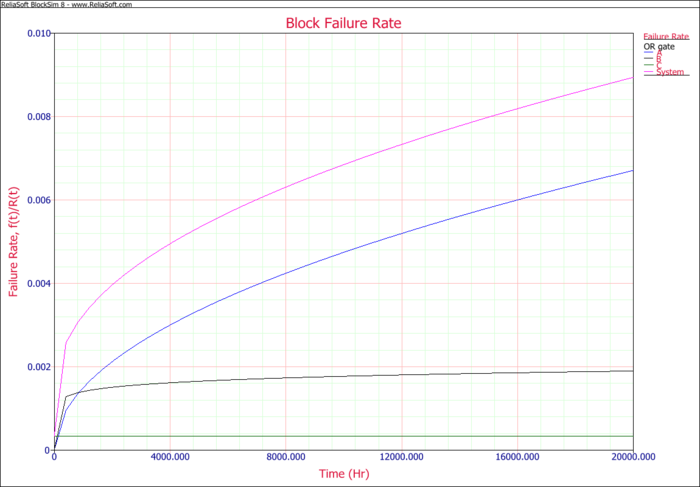
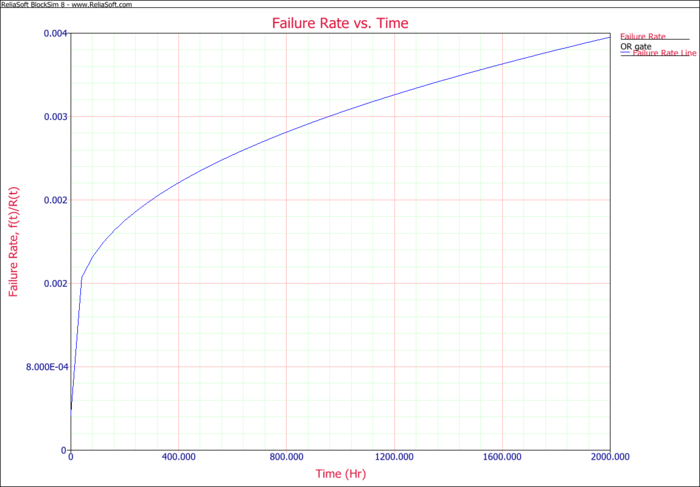
Failure Rate vs. Time
For the metrics, there are three kind of reliability importance plot available:
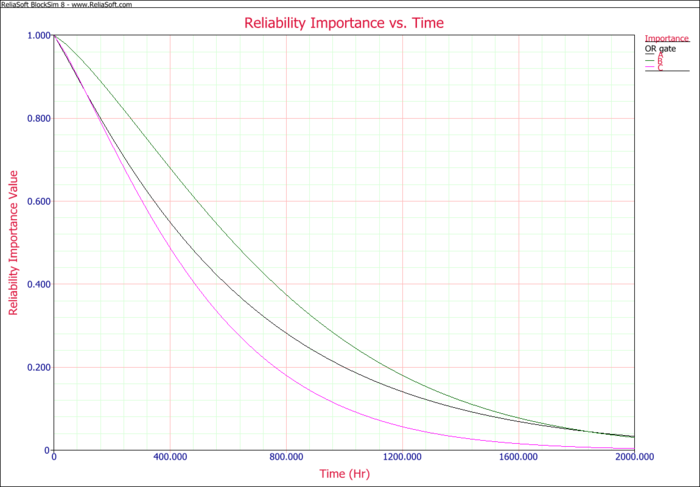
Reliability Importance vs. Time
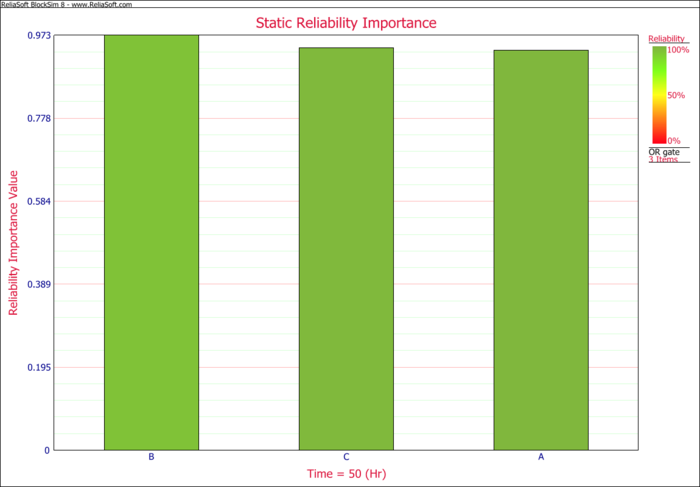
Static Reliability Importance
Static Reliability Importance(Tableau)
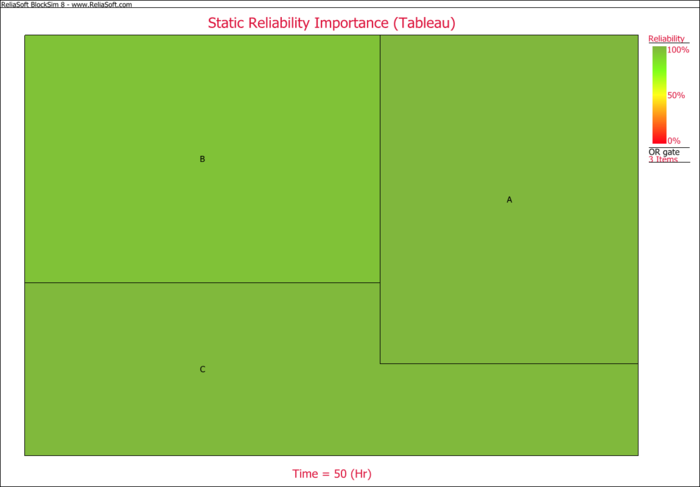
In block level, there are four kind of plots available:
Block Unreliability vs. Time
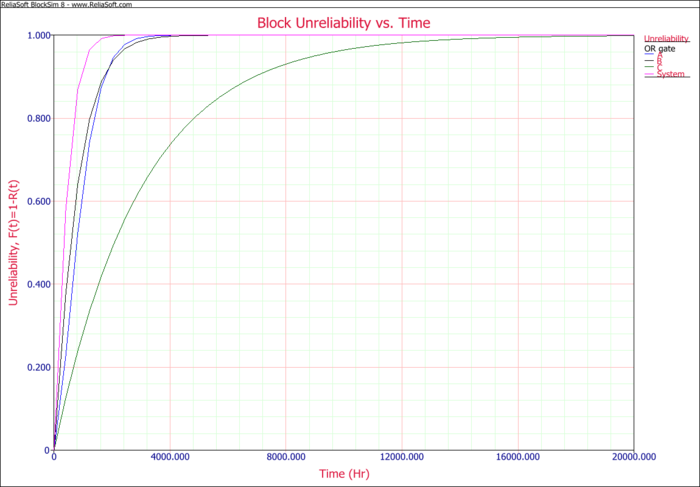
Block Reliability vs. Time
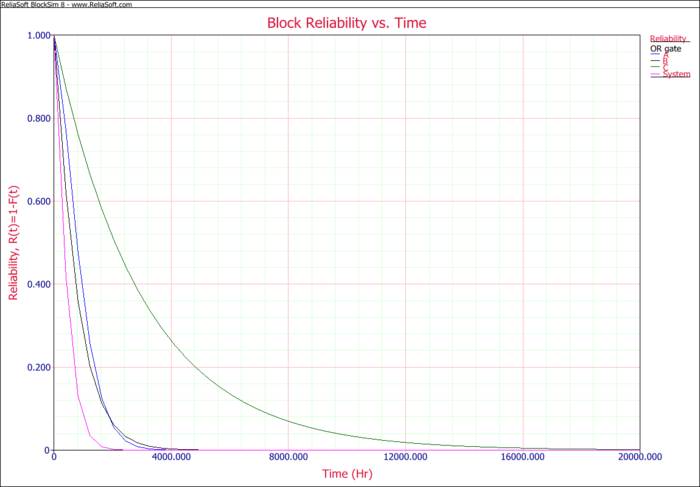
Block Probability Density Function
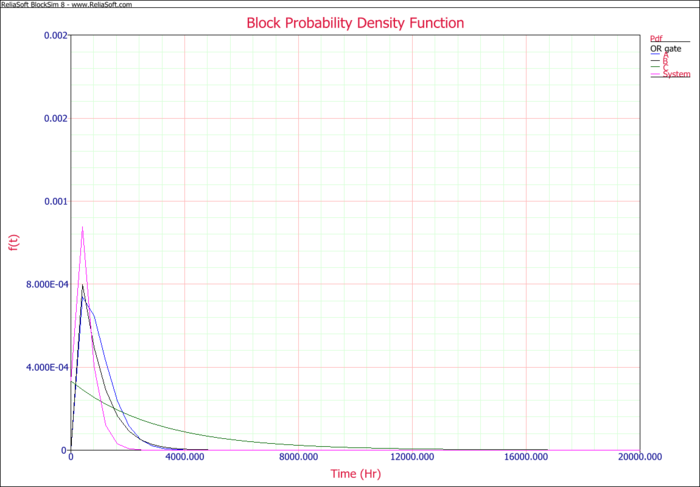
Block Failure Rate
