Auto Transmission Example
 |
New format available! This reference is now available in a new format that offers faster page load, improved display for calculations and images and more targeted search.
As of January 2024, this Reliawiki page will not continue to be updated. Please update all links and bookmarks to the latest references at RGA examples and RGA reference examples.
This example appears in the Reliability growth reference.
This case study is based on the data given in the article "Graphical Analysis of Repair Data" by Dr. Wayne Nelson [23]. The following table contains repair data on an automatic transmission from a sample of 34 cars. For each car, the data set shows mileage at the time of each transmission repair, along with the latest mileage. The + indicates the latest mileage observed without failure. Car 1, for example, had a repair at 7068 miles and was observed until 26,744 miles. Do the following:
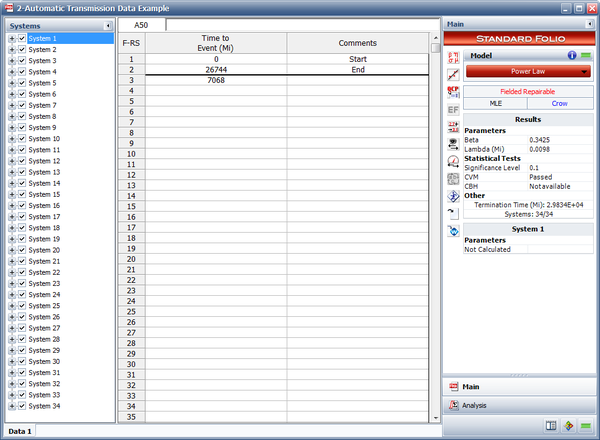
- Estimate the parameters of the Power Law model.
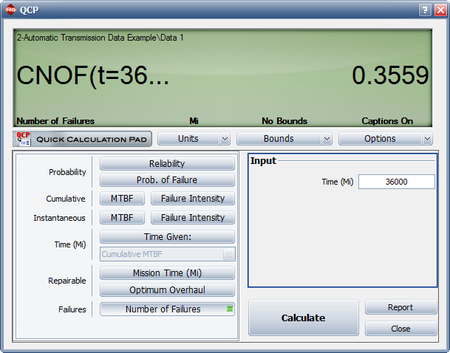
- Estimate the number of warranty claims for a 36,000 mile warranty policy for an estimated fleet of 35,000 vehicles.
| Automatic Transmission Data | ||||
| Car | Mileage | Car | Mileage | |
|---|---|---|---|---|
| 1 | 7068, 26744+ | 18 | 17955+ | |
| 2 | 28, 13809+ | 19 | 19507+ | |
| 3 | 48, 1440, 29834+ | 20 | 24177+ | |
| 4 | 530, 25660+ | 21 | 22854+ | |
| 5 | 21762+ | 22 | 17844+ | |
| 6 | 14235+ | 23 | 22637+ | |
| 7 | 1388, 18228+ | 24 | 375, 19607+ | |
| 8 | 21401+ | 25 | 19403+ | |
| 9 | 21876+ | 26 | 20997+ | |
| 10 | 5094, 18228+ | 27 | 19175+ | |
| 11 | 21691+ | 28 | 20425+ | |
| 12 | 20890+ | 29 | 22149+ | |
| 13 | 22486+ | 30 | 21144+ | |
| 14 | 19321+ | 31 | 21237+ | |
| 15 | 21585+ | 32 | 14281+ | |
| 16 | 18676+ | 33 | 8250, 21974+ | |
| 17 | 23520+ | 34 | 19250, 21888+ | |
Solution
- The estimated Power Law parameters are shown next.
- The expected number of failures at 36,000 miles can be estimated using the QCP as shown next. The model predicts that 0.3559 failures per system will occur by 36,000 miles. This means that for a fleet of 35,000 vehicles, the expected warranty claims are 0.3559 * 35,000 = 12,456.