Uploads by Kate Racaza
Jump to navigation
Jump to search
This special page shows all uploaded files.
| Date | Name | Thumbnail | Size | Description | Versions |
|---|---|---|---|---|---|
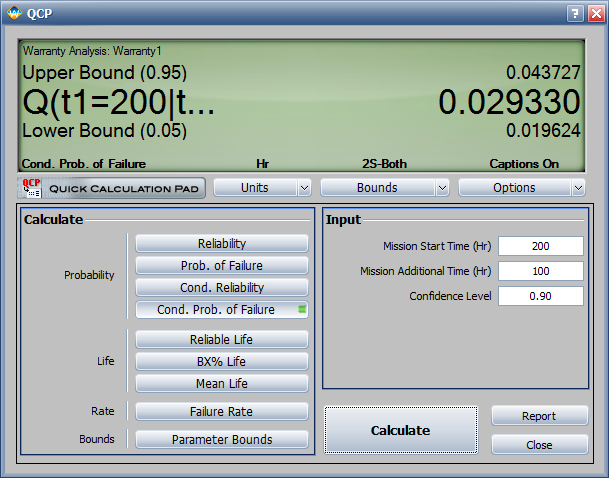
| 02:58, 15 August 2012 | Ipl example2 qcp.gif (file) |  |
30 KB | changed time unit from hours to cycles. | 3 |
| 02:24, 15 August 2012 | New 3.gif (file) |  |
37 KB | updated plot | 2 |
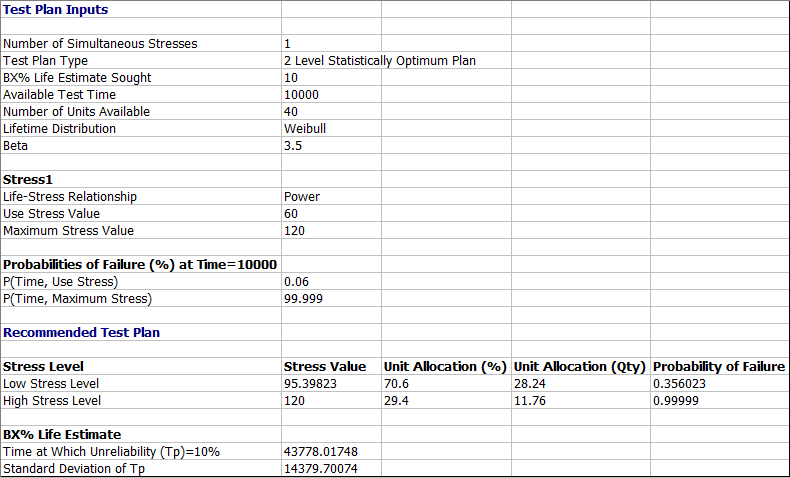
| 03:10, 2 August 2012 | Tpr.png (file) |  |
26 KB | replaced with clearer image | 3 |
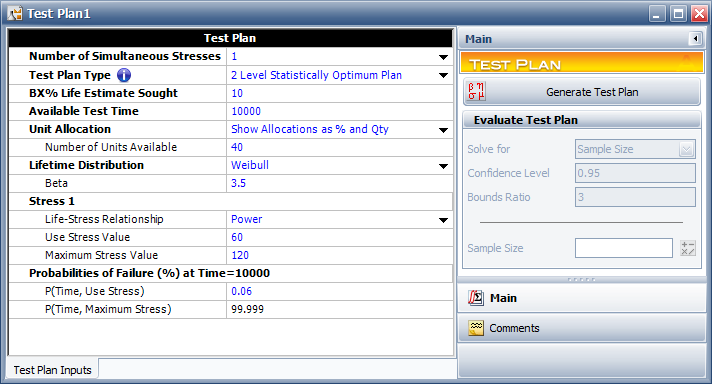
| 03:07, 2 August 2012 | 1testplan.png (file) |  |
40 KB | replaced blurry screenshot | 3 |
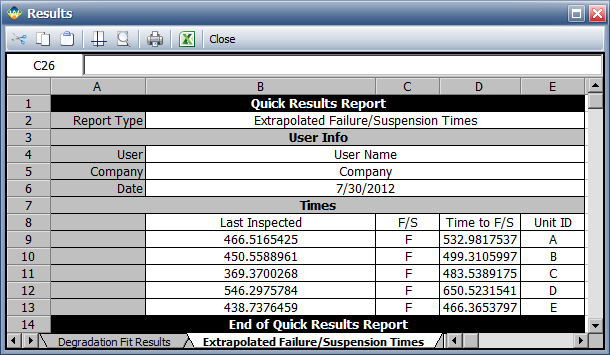
| 02:45, 30 July 2012 | Extraploated Failure Time Intervals.png (file) |  |
26 KB | removed User info | 2 |
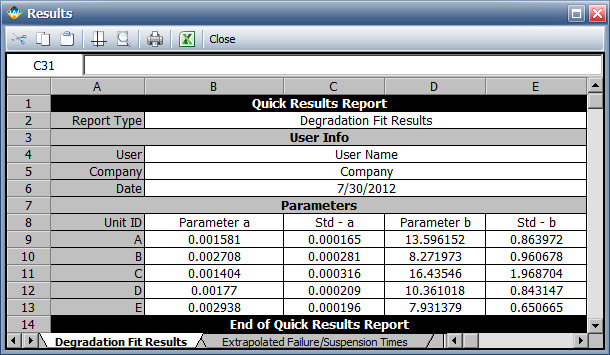
| 02:44, 30 July 2012 | Model Parameters and Stds.png (file) |  |
26 KB | removed User info | 2 |
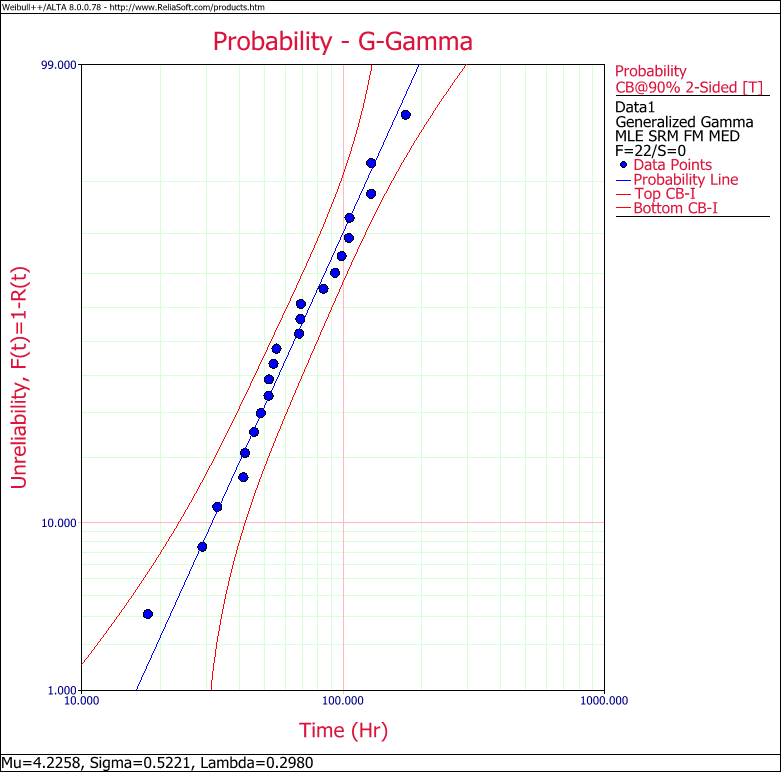
| 10:12, 27 July 2012 | GGamma Example 1 Plot.png (file) |  |
45 KB | removed User info | 2 |
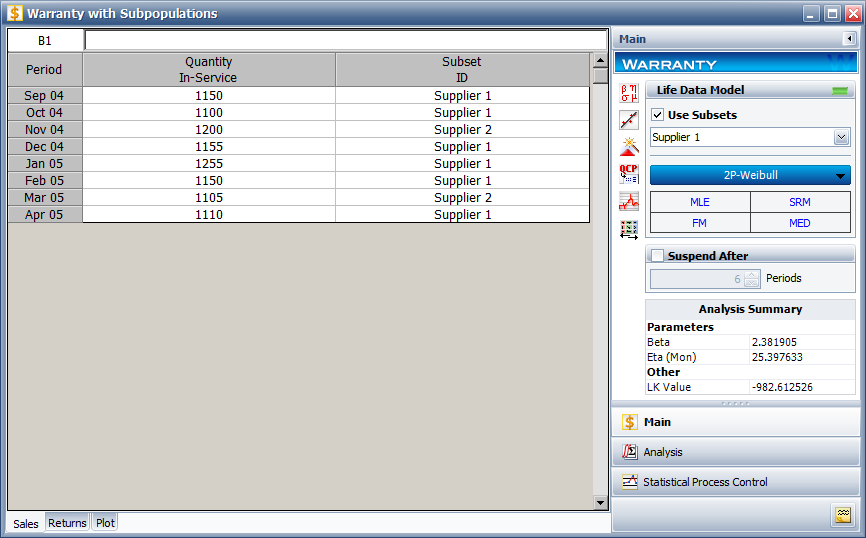
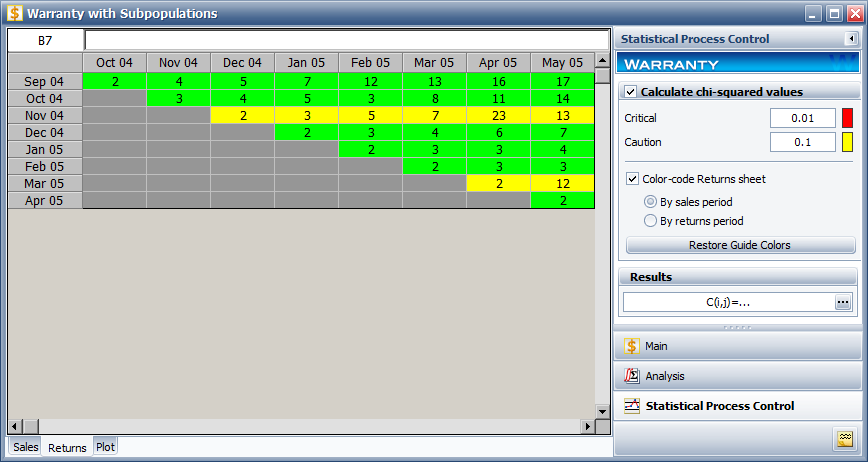
| 08:58, 26 July 2012 | Warranty Example 6 Subpopulation Datat.png (file) |  |
52 KB | updated result | 2 |
| 08:45, 26 July 2012 | Warranty Example 6 SPC Result.png (file) |  |
44 KB | displayed SPC page instead | 2 |
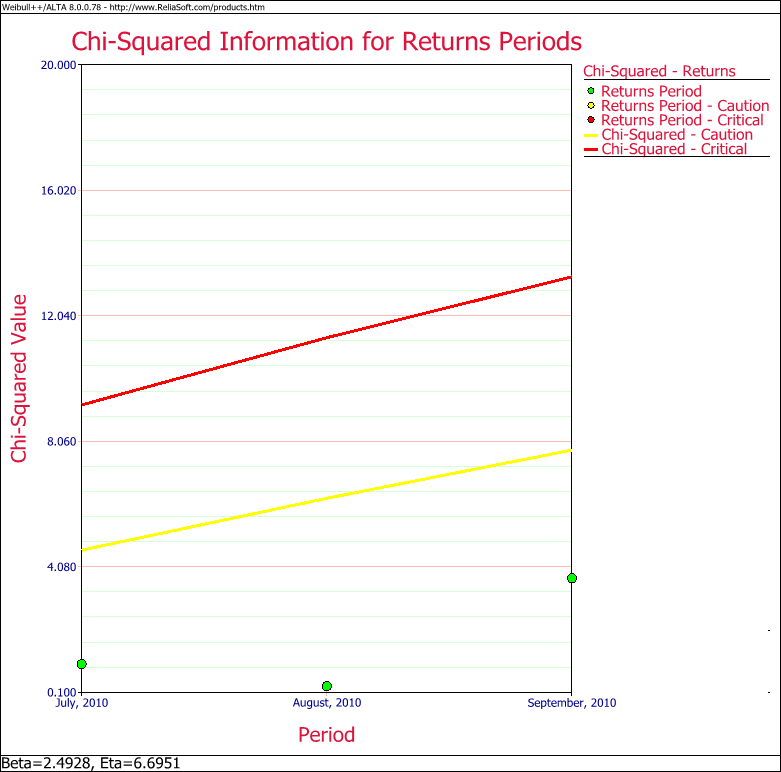
| 07:43, 26 July 2012 | Warranty Example 5 SPC Return.png (file) |  |
43 KB | removed User info | 2 |
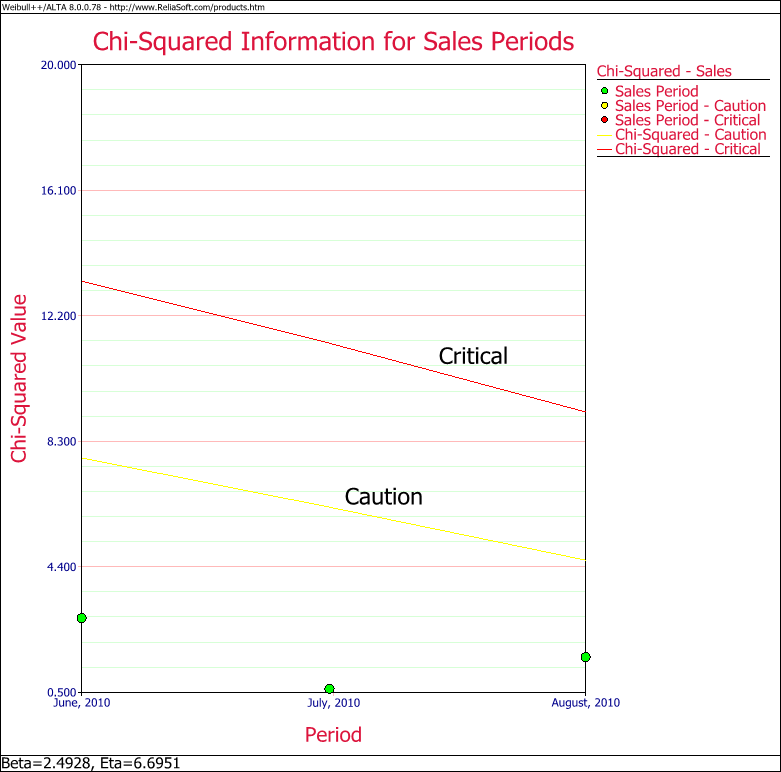
| 07:42, 26 July 2012 | Warranty Example 5 SPC Sales.png (file) |  |
45 KB | removed User info | 2 |
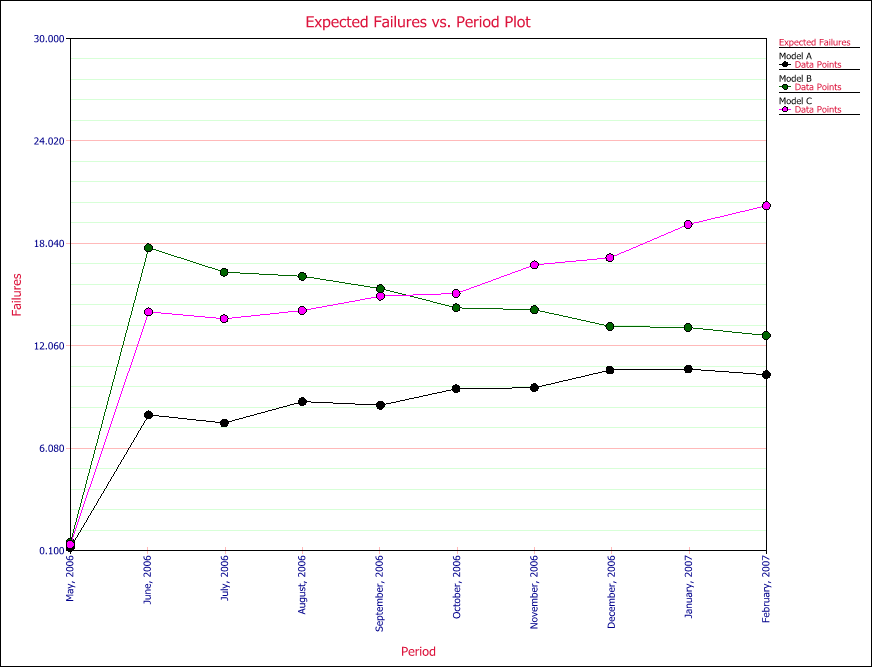
| 07:04, 26 July 2012 | Non-Homogeneous Expected Failure.PNG (file) |  |
31 KB | removed User info | 2 |
| 07:03, 26 July 2012 | Non-Homogeneous Analysis Summary.PNG (file) |  |
28 KB | removed User info | 2 |
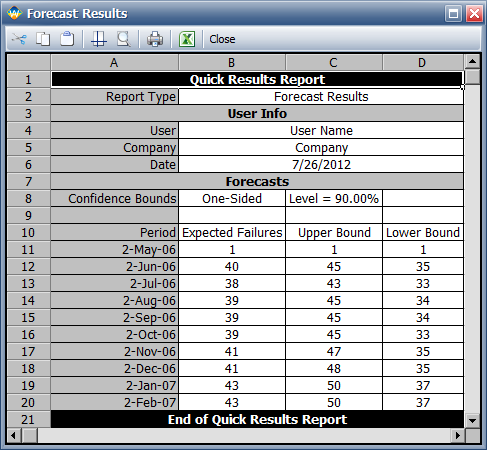
| 07:02, 26 July 2012 | Non-Homogeneous Forecast Data.PNG (file) |  |
69 KB | updated screenshot | 2 |
| 05:45, 26 July 2012 | Usage Example Reliability Plot.png (file) |  |
31 KB | removed User info | 2 |
| 05:43, 26 July 2012 | Usage Example Weibull Std Folio Data.png (file) |  |
68 KB | added "incomplete data" label | 3 |
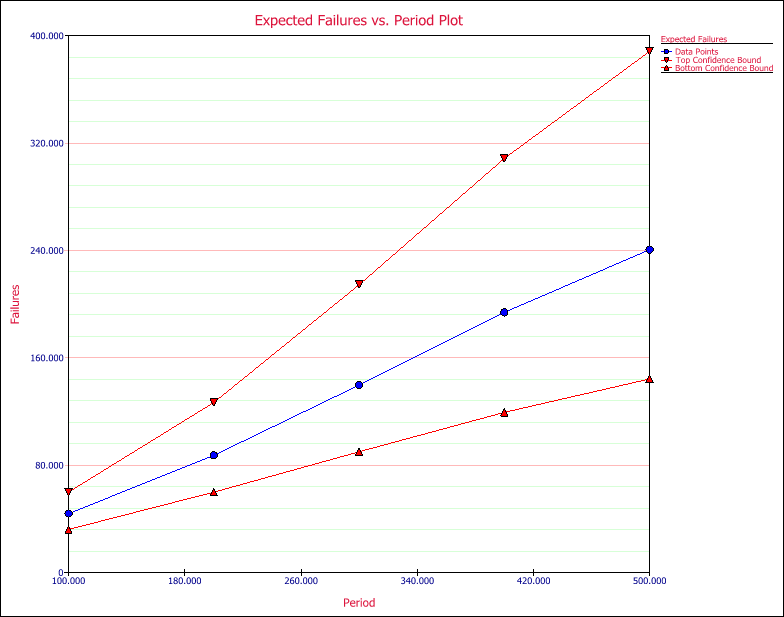
| 10:16, 24 July 2012 | Warranty Dates Format Predicted Failures Plot.png (file) |  |
26 KB | updated example and removed User info | 2 |
| 10:09, 24 July 2012 | Warranty Dates Format Summary.png (file) |  |
37 KB | 2 | |
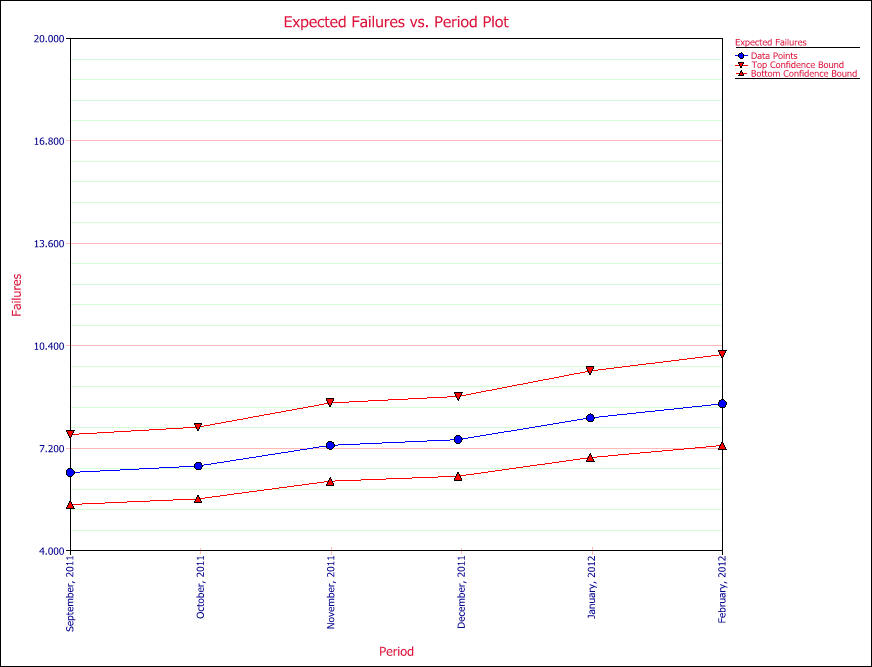
| 08:51, 24 July 2012 | Warranty Select Expected Failure Plot.png (file) |  |
22 KB | removed User info | 2 |
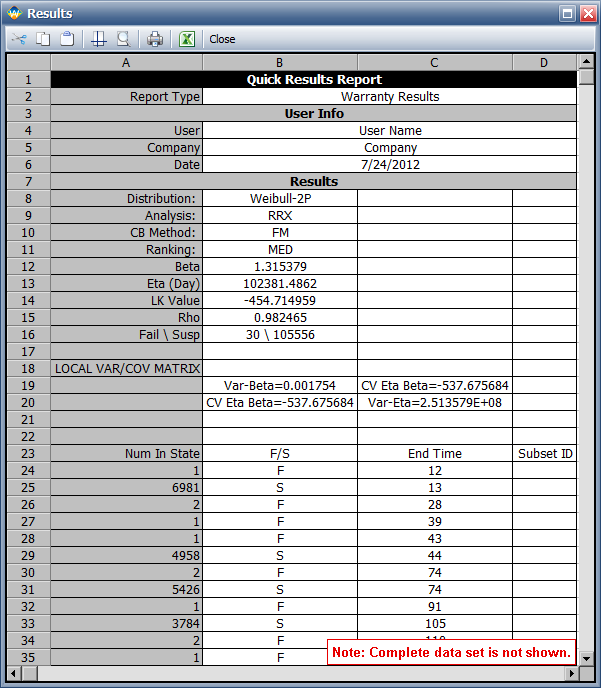
| 08:49, 24 July 2012 | Warranty Select QCP Result.png (file) |  |
70 KB | removed cluttered calculation log | 2 |
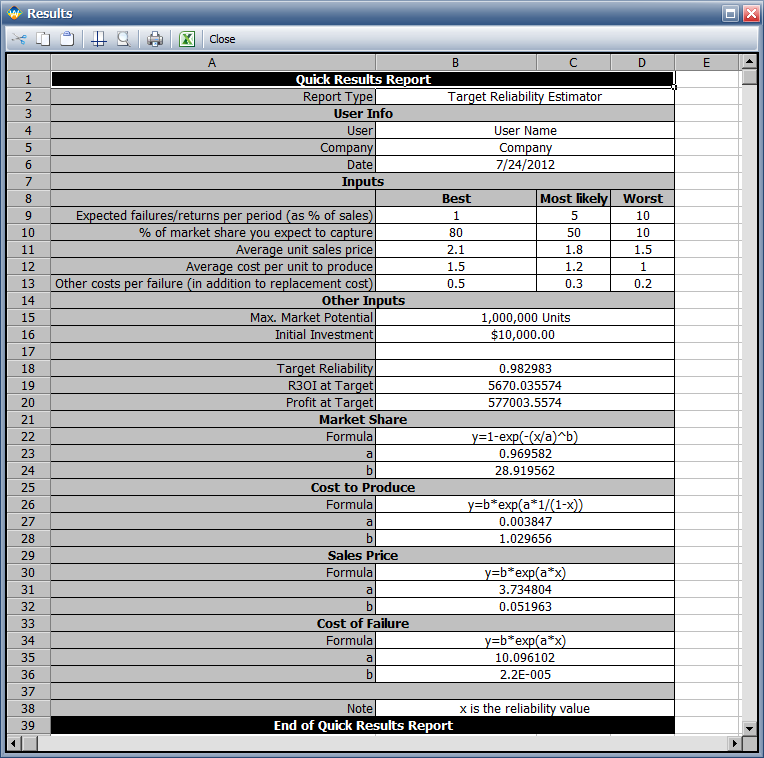
| 06:57, 24 July 2012 | Target Reliability Example Model Results.png (file) |  |
57 KB | removed User info | 2 |
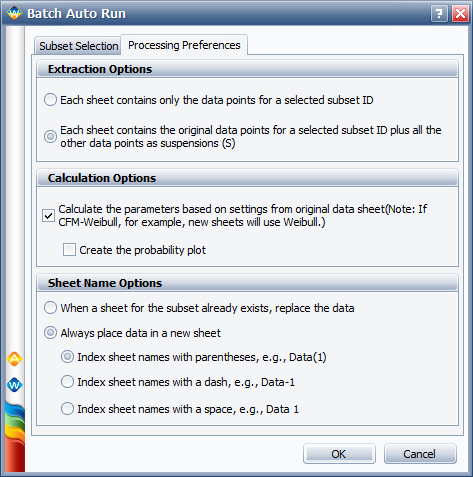
| 05:56, 24 July 2012 | Batch Auto Run.png (file) |  |
37 KB | 1 | |
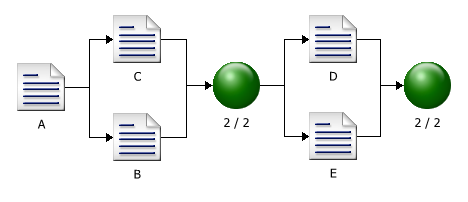
| 05:55, 24 July 2012 | Competing Failure Mode Example 2 Diagram.png (file) |  |
10 KB | updated example | 2 |
| 03:56, 24 July 2012 | Competing Failiure Mode W Mode Data.png (file) |  |
54 KB | updated screenshot | 3 |
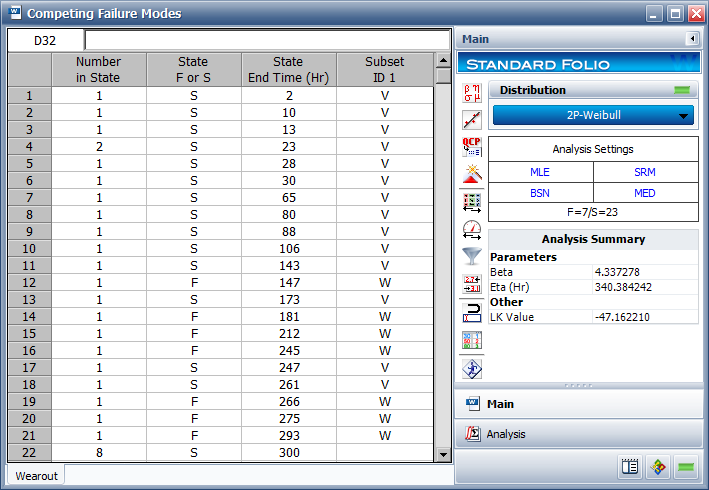
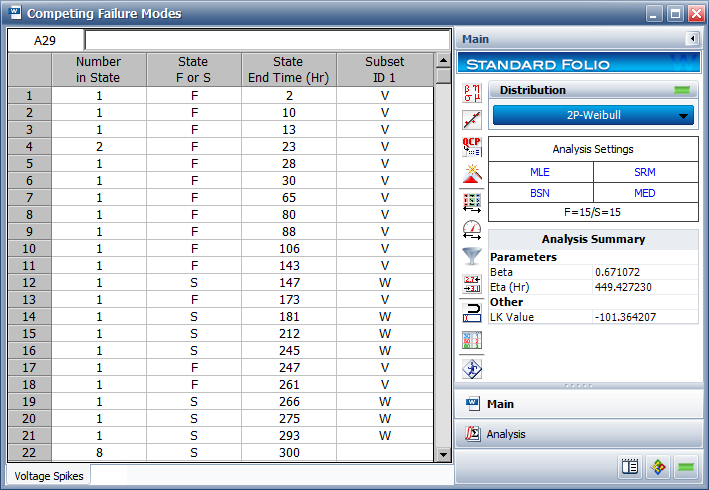
| 03:56, 24 July 2012 | Competing Failiure Mode V Mode Data.png (file) |  |
54 KB | updated screenshot | 2 |
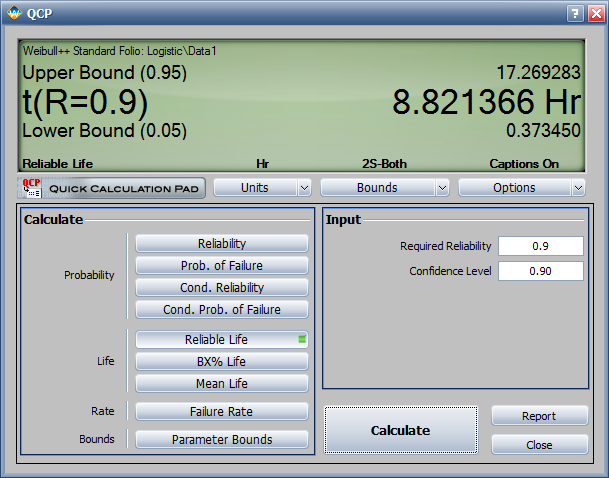
| 09:51, 23 July 2012 | Logistic Distribution Exmaple 1 QCP Reliable Life.png (file) |  |
69 KB | 3 | |
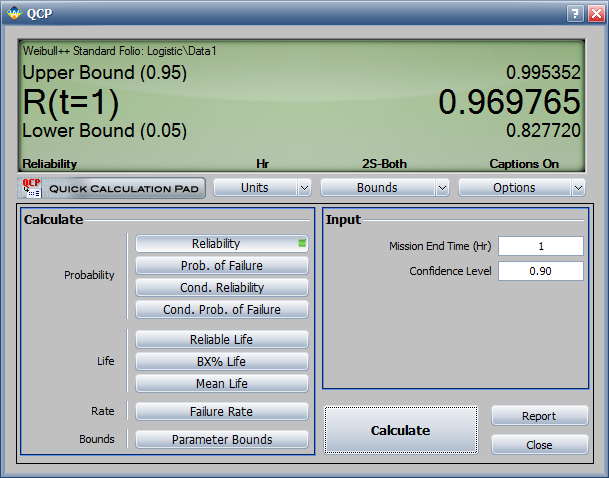
| 09:43, 23 July 2012 | Logistic Distribution Exmaple 1 QCP Reliability.png (file) |  |
68 KB | removed the cluttered calculation log | 2 |
| 08:40, 23 July 2012 | Weibull Distribution Example 6 pdf.png (file) |  |
24 KB | removed User info | 2 |
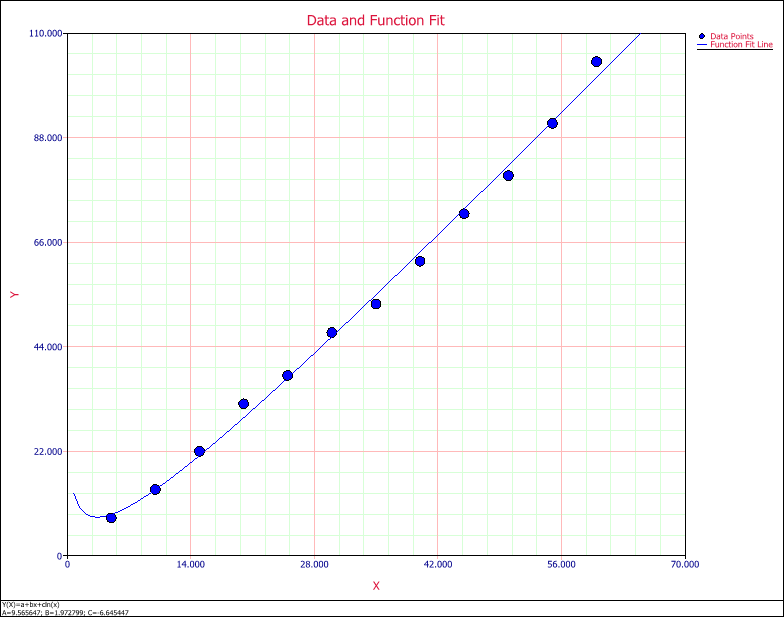
| 07:27, 23 July 2012 | Equation Fit Solver Plot.png (file) |  |
20 KB | removed User info | 2 |
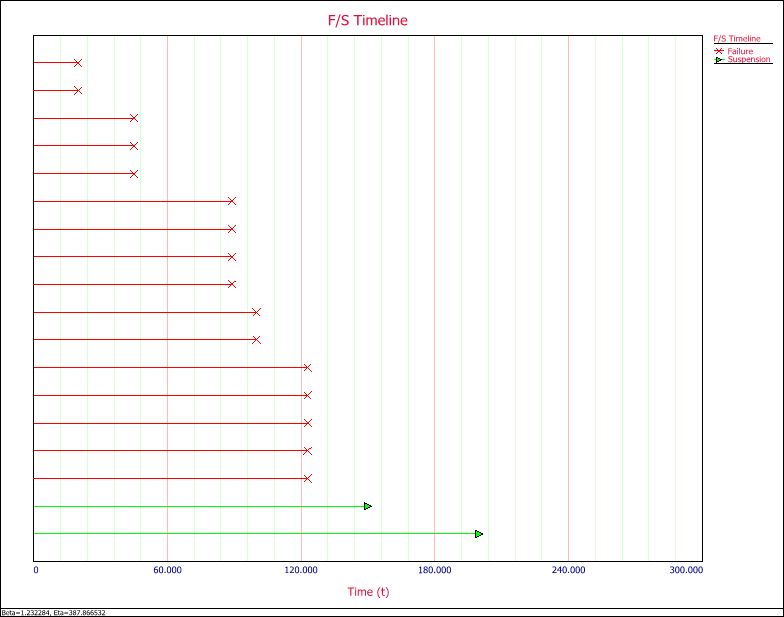
| 04:10, 23 July 2012 | Plot Type Time line plot.png (file) |  |
13 KB | removed User info | 2 |
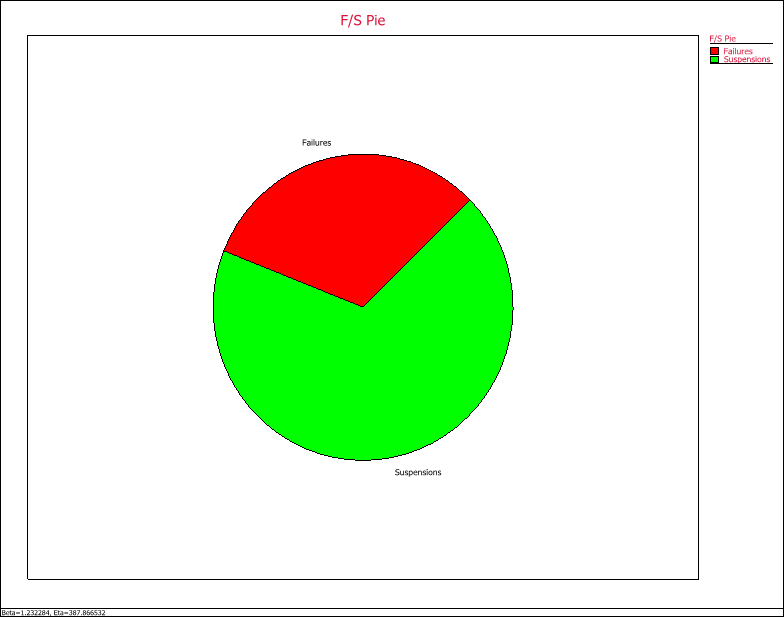
| 04:10, 23 July 2012 | Plot Type Pie plot.png (file) |  |
11 KB | removed User info | 2 |
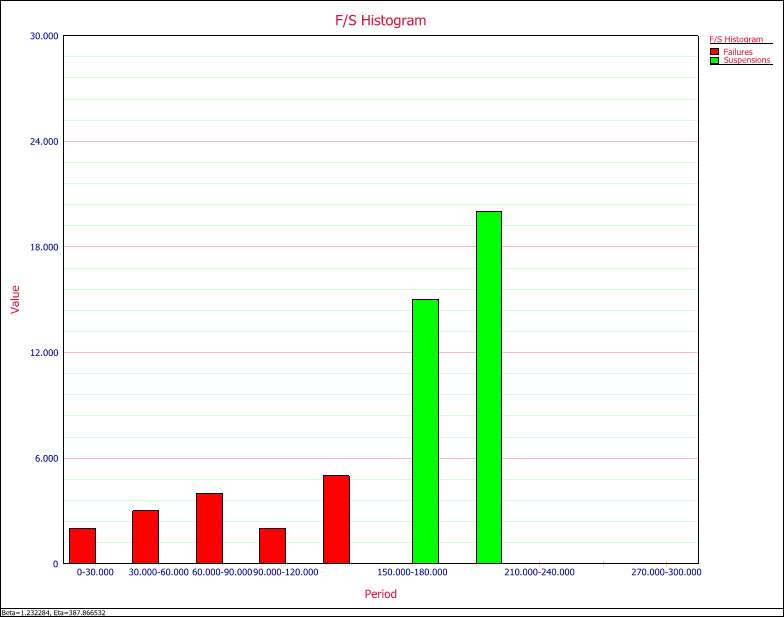
| 04:10, 23 July 2012 | Plot Type histogram plot.png (file) |  |
19 KB | removed User info | 2 |
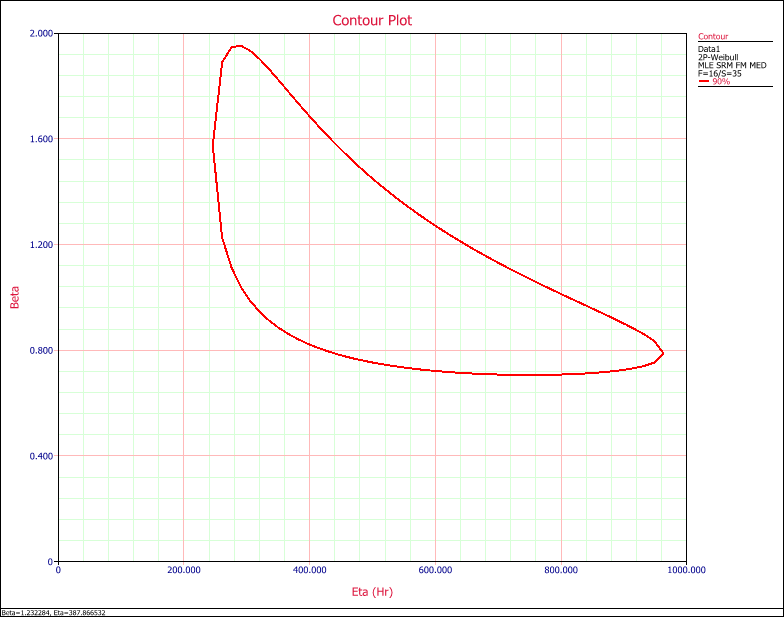
| 04:09, 23 July 2012 | Plot Type Contour plot.png (file) |  |
20 KB | removed User info | 2 |
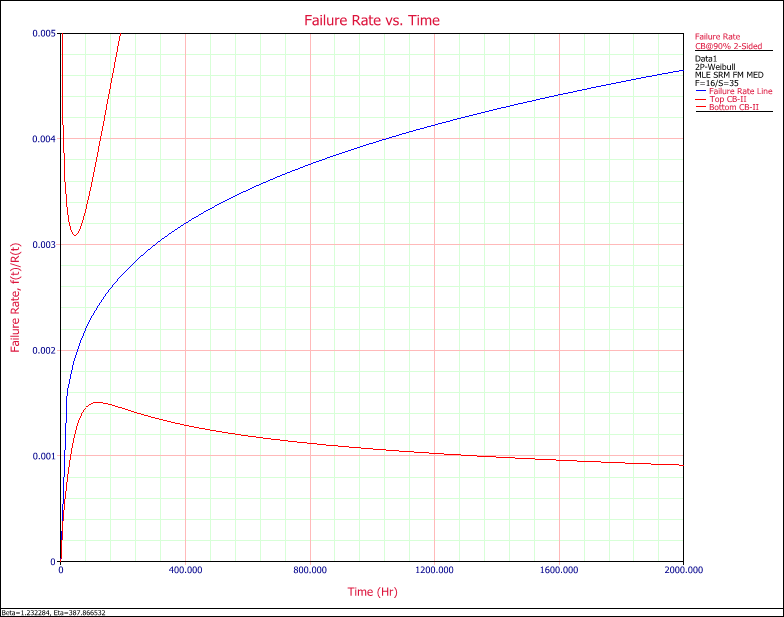
| 04:09, 23 July 2012 | Plot Type failure rate plot.png (file) |  |
26 KB | removed User info | 2 |
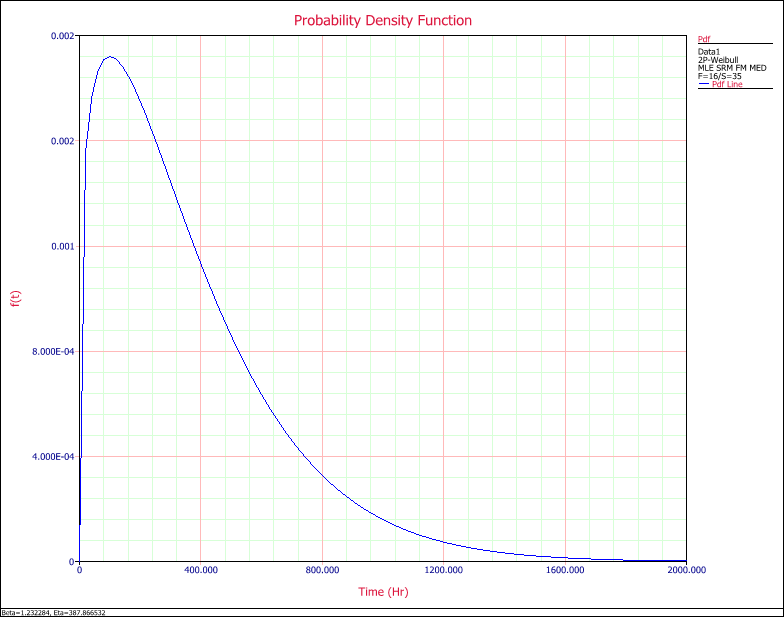
| 04:09, 23 July 2012 | Plot Type pdf plot.png.png (file) |  |
22 KB | removed User info | 2 |
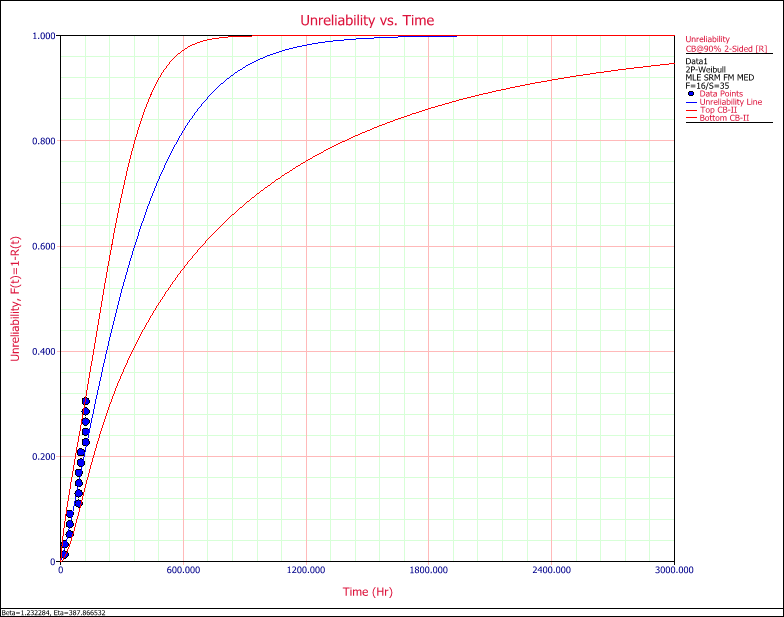
| 04:09, 23 July 2012 | Plot Type UnReliability plot.png (file) |  |
29 KB | removed User info | 2 |
| 04:08, 23 July 2012 | Plot Type Reliability plot.png (file) |  |
29 KB | removed User info | 2 |
| 04:08, 23 July 2012 | Plot Type Reliability confidence bound.png (file) |  |
30 KB | removed User info | 2 |
| 04:07, 23 July 2012 | Plot Type Probability Plot.png (file) |  |
25 KB | removed User info | 2 |
| 10:15, 20 July 2012 | 1P Weibull QCP.png (file) |  |
68 KB | 3 | |
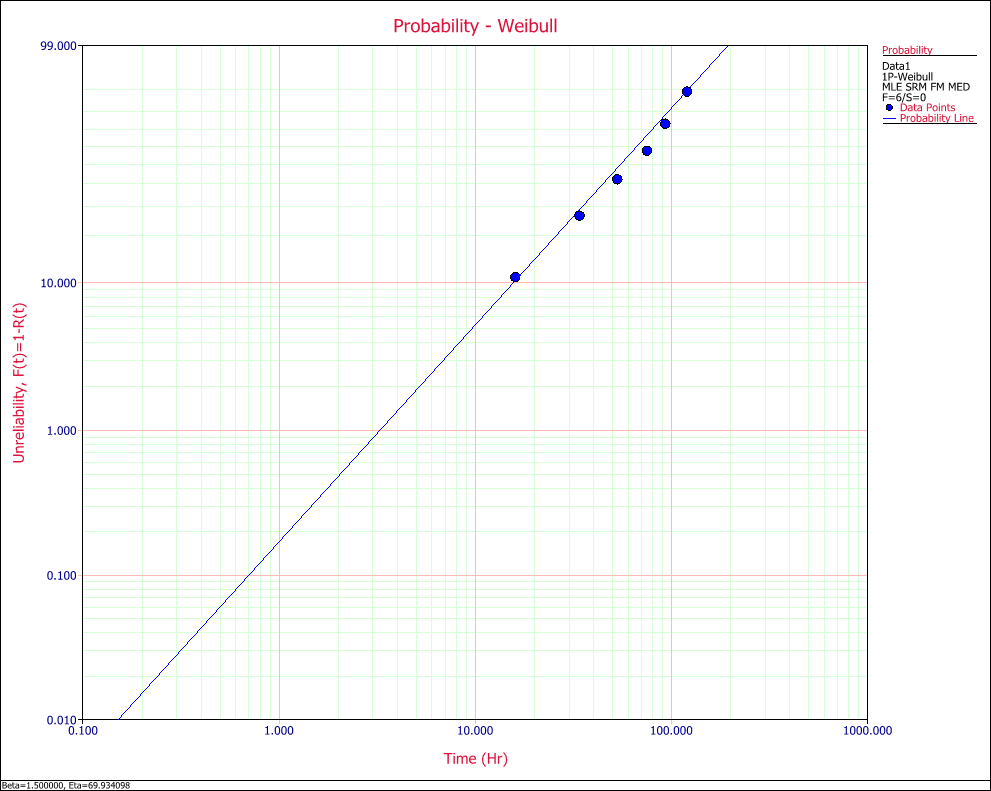
| 10:09, 20 July 2012 | 1P Weibull PPlot.png (file) |  |
32 KB | 2 | |
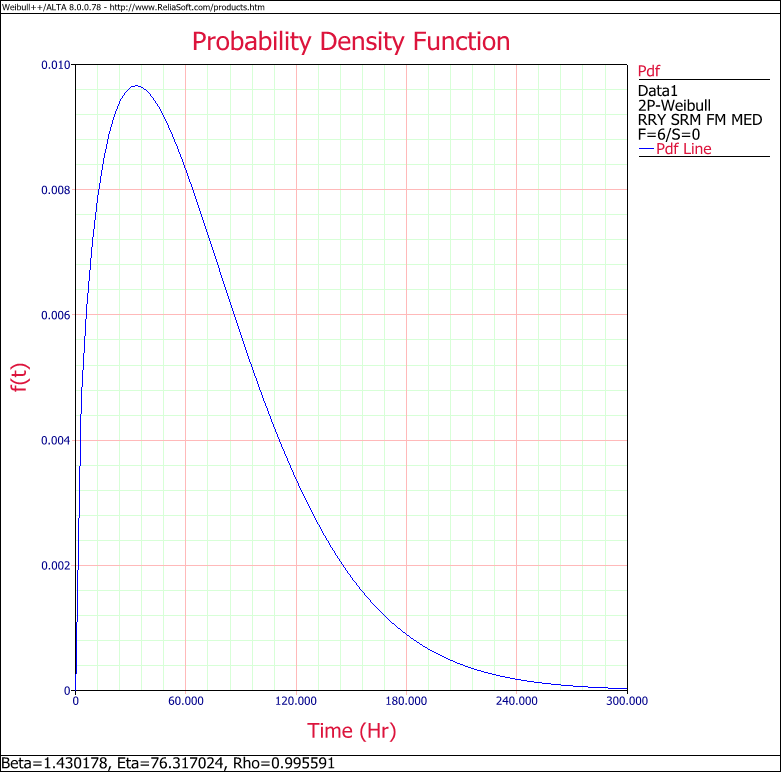
| 23:35, 6 April 2012 | Weibull Distribution Example 3 pdf Plot.png (file) |  |
34 KB | removed Harry's name from the plot | 2 |
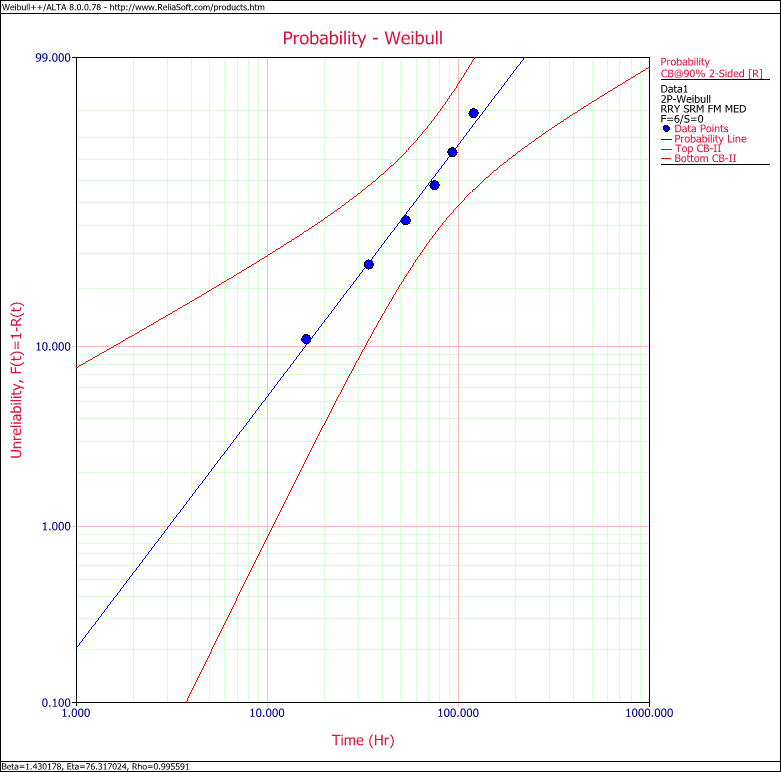
| 23:33, 6 April 2012 | Weibull Distribution Example 3 RRY Confidence Plot.png (file) |  |
38 KB | removed Harry's name from the plot. | 2 |
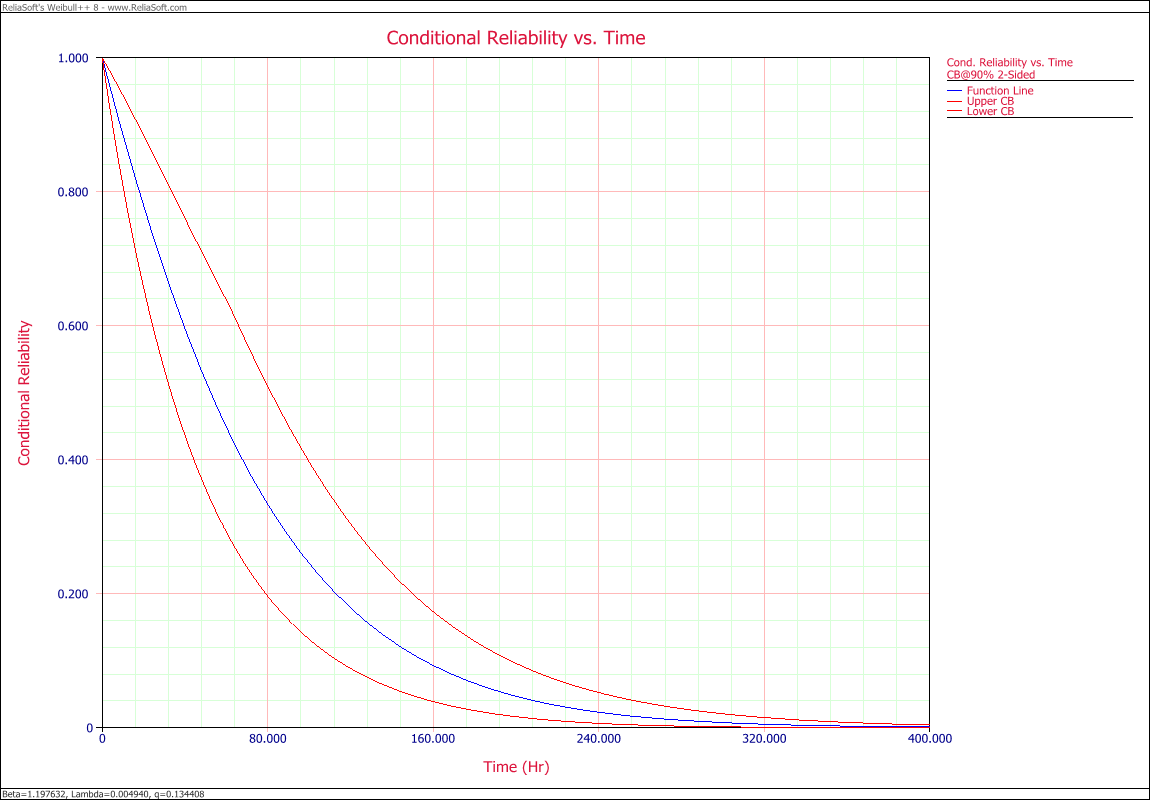
| 15:54, 19 March 2012 | Parametric RDA Cond R(T) plot.png (file) | _plot.png) |
39 KB | removed author's name | 2 |
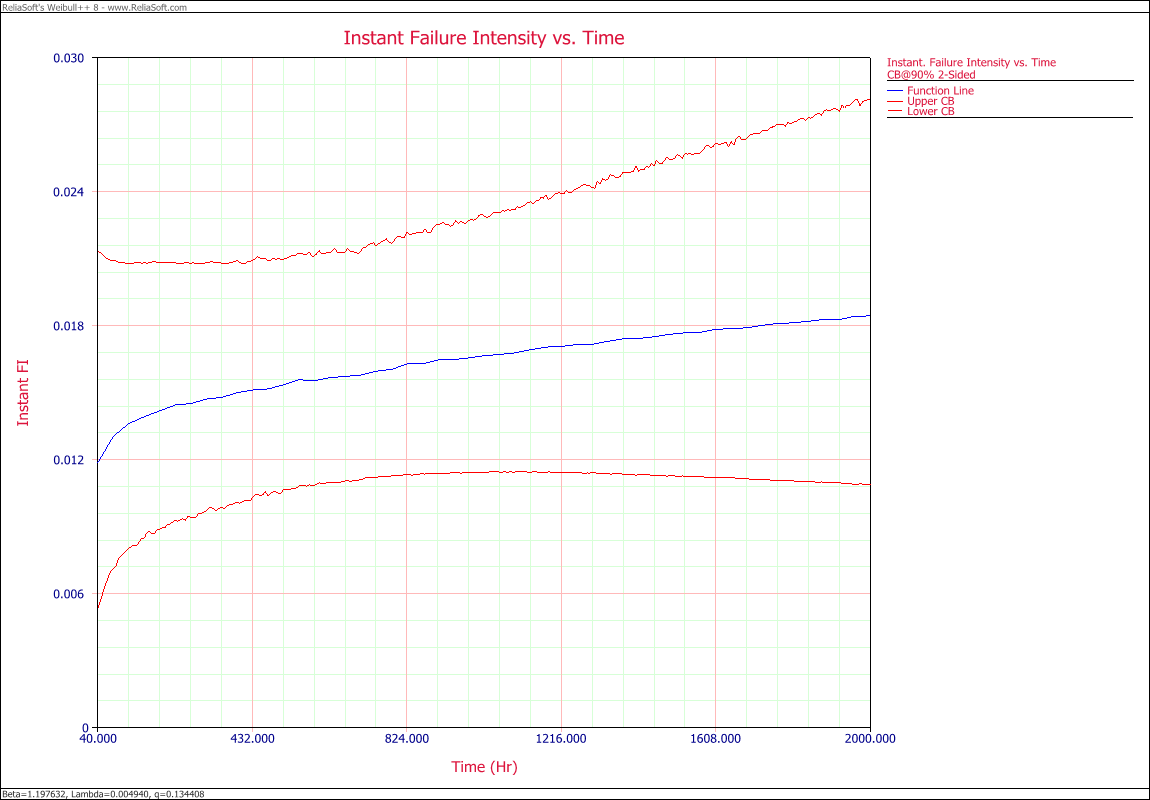
| 15:54, 19 March 2012 | Parametric RDA Lambda(T) plot.png (file) | _plot.png) |
37 KB | removed author's name | 2 |
| 15:53, 19 March 2012 | Parametric RDA N(T) plot.png (file) | _plot.png) |
45 KB | removed author's name | 2 |
| 15:52, 19 March 2012 | Recurrent Data Example 3 Plot.png (file) |  |
38 KB | removed author's name | 2 |
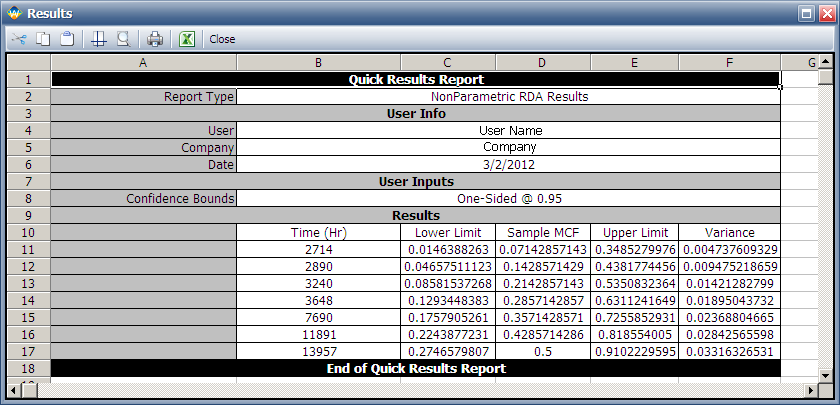
| 15:52, 19 March 2012 | Recurrent Data Example 3 Result.png (file) |  |
36 KB | removed author's name | 2 |
| 15:49, 19 March 2012 | Recurrent Data Example 2 Plot.png (file) |  |
38 KB | removed author's name | 2 |
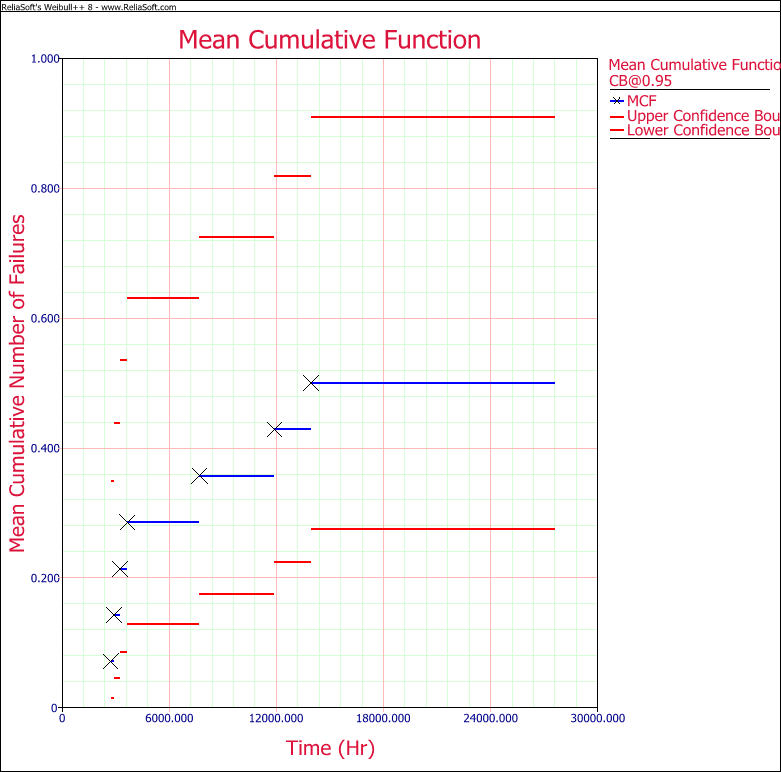
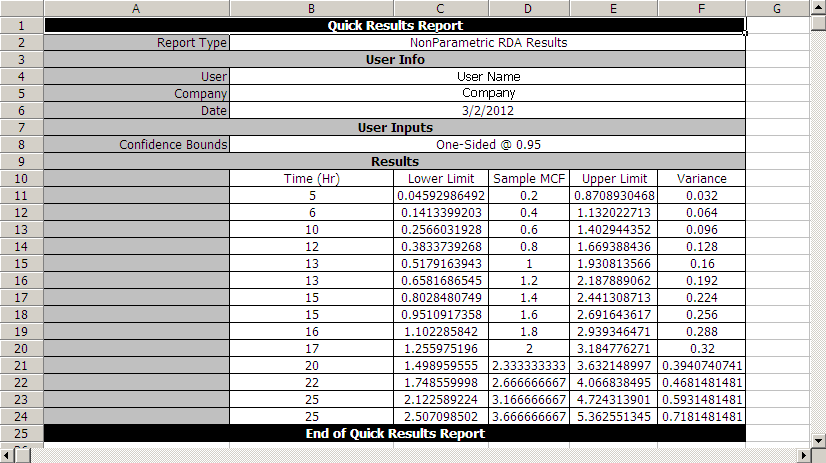
| 23:49, 16 March 2012 | Recurrent Data Example 2 Result.png (file) |  |
35 KB | 2 |