Example Using Success Failure Paths in Phase Diagrams
 |
New format available! This reference is now available in a new format that offers faster page load, improved display for calculations and images and more targeted search.
As of January 2024, this Reliawiki page will not continue to be updated. Please update all links and bookmarks to the latest references at BlockSim examples and BlockSim reference examples.
This example appears in the System analysis reference.
Success/Failure Paths
For a failure path, on system failure, the system goes to somewhere immediately when the failure occurs. For a success path, if there is no system failure during this phase, the system goes to somewhere by the end of the current phase.
In BlockSim 7, there was only one path from each phase. The failure outcome for each phase was defined via a drop-down list. The success and failure paths used in BlockSim 8 and above make it easy to see what will happen upon success or failure for each block. They also allow you to create more complex phase diagrams, in which success and failure may lead to entirely different sets of phases. In addition, they offer an additional possible outcome of failure. Previously, the outcome of failure could be maintenance, stopping the simulation or continuing the simulation; now another possible outcome of failure can be continuing simulation on a different path.
For example, consider a system whose RBDs for Phase 1 and Phase 2 are as shown in the figure below:
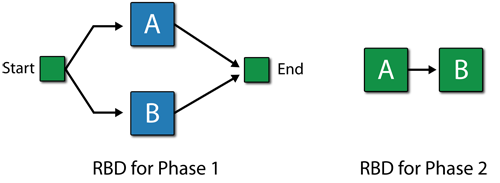
In Phase 1, Block A follows Weibull distribution with Beta = 1.5 and Eta = 1000 hours. Block B follows Weibull distribution with Beta = 1.5 and Eta = 1200 hours. No maintenance.
In Phase 2, Block A follows Weibull distribution with Beta = 1.5 and Eta = 900 hours. Block B follows Weibull distribution with Beta = 1.5 and Eta = 1150 hours. No maintenance.
Scenario 1
Suppose the phase diagram is as shown next. The maintenance phase has a CM with duration 80 hours and PM with duration 20 hours for both Block A and B. Phase 1 has a duration 100 hours and Phase 2 has a duration 500 hours. If there is no failure in Phase 1, upon finish, it goes to Phase 2. If there is a failure in Phase 1, it would immediately go to Maintenance Phase 3. If there is no failure in Phase 2, upon finish, it goes back to Phase 1. If there is a failure in Phase 2, it would immediately go to Maintenance Phase 3.
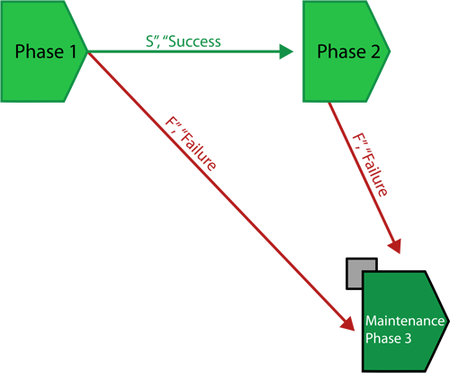
The Block Up/Down plot is shown below:
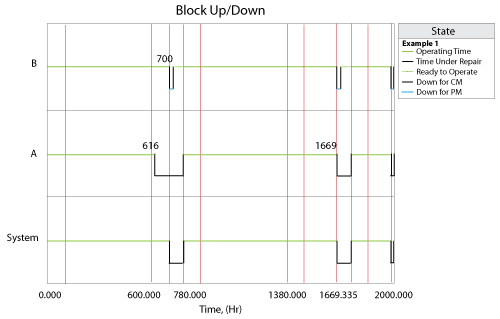
- At the first cycle (0-100 hours for Phase 1 and 200-600 hours for Phase 2), there is no failure, thus after Phase 2, Phase 1 is executed (back to Phase 1 after this cycle).
- At 616 hours (Phase 1 of the second cycle), Block A fails. The system doesn't enter Maintenance Phase 3 immediately because in Phase 1, Block A and Block B are parallel. Failure of only Block A does not bring the system down.
- At 700 hours, after Phase 1, the system goes into Phase 2. In Phase 2, the failure of Block A (passed from Phase 1) brings the system down because in Phase 2, Block A is in series with Block B. Thus the system goes into Maintenance Phase 3 immediately. Block B is not down, thus it gets PM with duration 20 hours. Block A gets CM with duration 100 hours.
- At 1669 hours, Block A fails in Phase 2, which brings down the system and the system goes into Maintenance Phase 3 immediately. Block A gets CM and Block B gets PM.
Scenario 2
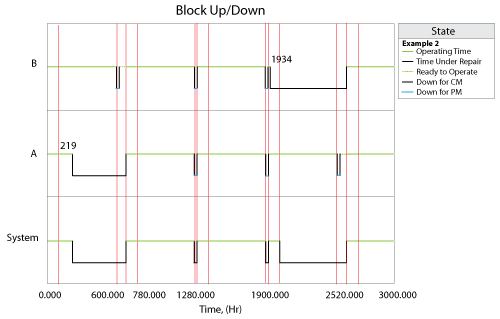
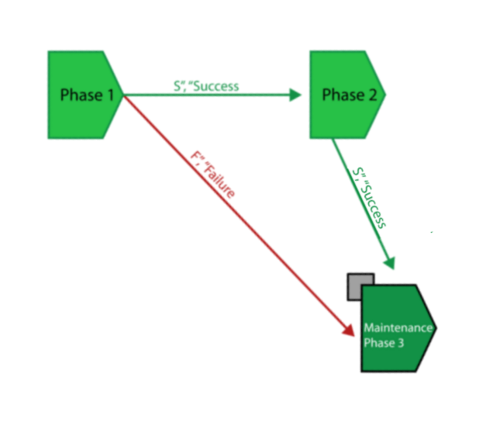
Now suppose that the phase diagram is as follows, where everything is the same as in Example 1 except that the path from Phase 2 to Maintenance Phase 3 changes from a failure path to a success path. This means that whether or not there is a failure in Phase 2, the system would go to the Maintenance Phase 3 after Phase 2. But if there is a failure in Phase 2, the system would go to the Maintenance Phase 3 after Phase 2, not immediately.
The Block Up/Down plot is shown below:
- At 219 hours, Block A fails in Phase 2. This failure brings the system down. However, since the path from Phase 2 to Maintenance Phase 3 is a success path, the system doesn't go into Maintenance Phase 3 immediately. Instead, it goes into Maintenance Phase 3 after Phase 2 ends. Block A gets CM and Block B gets PM in the maintenance phase.
- At 1934 hours, Block B fails in Phase 1. This failure doesn't bring the system down because in Phase 1, the system is in parallel structure. After Phase 1, the system goes into Phase 2 and the failure of Block B brings they system down in Phase 2. However, the system doesn't go into Maintenance Phase 3 immediately because the path between them is a success path. The system goes into Maintenance Phase 3 after Phase 2 ends, and Block B gets CM and Block A gets PM there.
