RGA_Reference_Examples_Banner.png
|
RGA_Reference_Examples |
This example compares the results for grouped per configuration data.
Reference Case
MIL-HDBK-189C, Section 6.2.3.2, pg. 86, 2011.
Data
The following table shows the data.
| Configuration Number | Number of Failures in Configuration | Number of Trials in Configuration |
|---|---|---|
| 1 | 5 | 14 |
| 2 | 3 | 19 |
| 3 | 4 | 15 |
| 4 | 4 | 20 |
Result
The book has the following results:
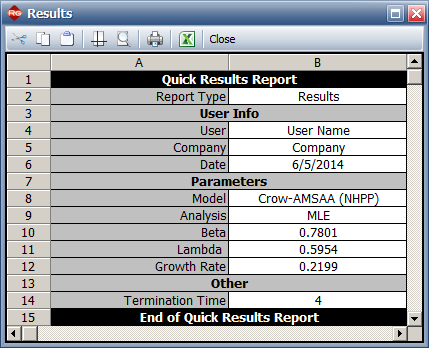
Beta = 0.780, Lambda = 0.595
| Configuration i | Reliability for Configuration i |
|---|---|
| 1 | 0.667 |
| 2 | 0.766 |
| 3 | 0.794 |
| 4 | 0.810 |
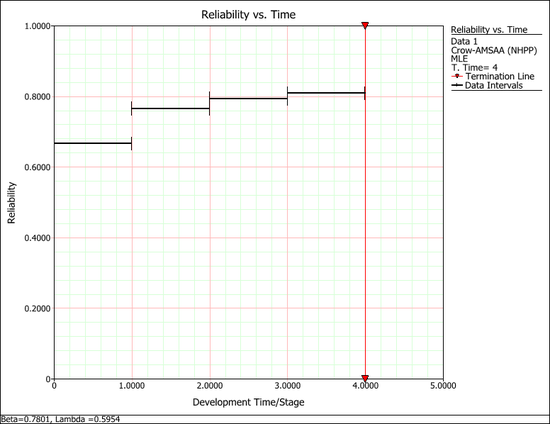
Results in RGA

| Configuration i | Reliability for Configuration i |
|---|---|
| 1 | 0.6668 |
| 2 | 0.7662 |
| 3 | 0.7939 |
| 4 | 0.8096 |
