Norris-Landzberg-Exponential Model
ALTA_Reference_Examples_Banner.png
|
ALTA_Reference_Examples |
This example compares the results for the Norris-Landzberg life-stress relationship. This can be accomplished in ALTA by using the general log-linear model (GLL) with proper stress transformations.
Reference Case
The data set is from Example 7.2 on page 257 in book Life Cycle Reliability Engineering by Dr. Guangbin Yang, John Wiley & Sons, 2007.
Data
The following table shows the thermal cycling profiles and test results for chip-scale package solder joints. In this example, the thermal cycling profile is represented by three independent stresses. These are: maximum temperature ([math]\displaystyle{ \,\!T_{Max} }[/math]), temperature difference ([math]\displaystyle{ \,\!\Delta T }[/math]) and cycling frequency ([math]\displaystyle{ \,\!f }[/math]).
The thermal cycling profiles and test results for chip-scale package solder joints are given below. A thermal cycling profile can be represented by 3 independent stresses in Norris-Landzberg relationship. They are the maximum temperature ([math]\displaystyle{ \,\!T_{Max} }[/math]), the temperature difference ([math]\displaystyle{ \,\!\Delta T }[/math]) and cycling frequency ([math]\displaystyle{ \,\!f }[/math]).
| Failure Time | TMAX (°C) | Delta T (°C) | [math]\displaystyle{ \,\!f }[/math] |
|---|---|---|---|
| 208 | 80 | 120 | 1 |
| 225 | 80 | 120 | 2 |
| 308 | 80 | 120 | 3 |
| 142 | 100 | 140 | 2 |
| 108 | 120 | 160 | 2 |
| 169 | 100 | 120 | 2 |
| 131 | 120 | 120 | 2 |
| 1300 | 80 | 50 | 2 |
| 650 | 100 | 70 | 2 |
| 258 | 120 | 90 | 2 |
| 6231 | 30 | 50 | 2 |
| 1450 | 30 | 70 | 2 |
Result
For this data set, a multiple linear regression model is used in the book. The model parameters are estimated using the least squared estimation. The regression model is shown next:
- [math]\displaystyle{ \begin{align}\\ =&ln\left ( L \right )=\alpha _{0}+\alpha _{1}ln\left ( \Delta T \right )+\alpha _{3}ln\left ( \frac{1}{T_{MAX}} \right )\\ \\ =&9.517-2.0635\times ln\left ( \Delta T \right )+0.3452\times ln\left ( f \right )+2006.4\times \left ( \frac{1}{T_{MAX}} \right ) \end{align}\,\! }[/math]
Results in ALTA
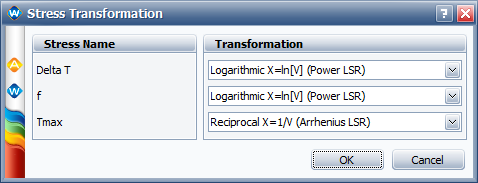
In ALTA, the General Log-linear model is used with the proper transformation for each stress. The failure time distribution is Exponential.
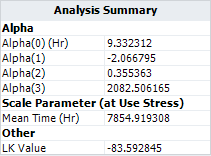
In ALTA, the maximum likelihood estimation is used. Therefore, the estimated model parameters are not exactly the same as the one given in the book where least squares method is used. The model result in ATLA is:
The above results are close to what the book has.

