Comparing the Standard and Modified Gompertz Models
 |
New format available! This reference is now available in a new format that offers faster page load, improved display for calculations and images and more targeted search.
As of January 2024, this Reliawiki page will not continue to be updated. Please update all links and bookmarks to the latest references at RGA examples and RGA reference examples.
This example appears in the Reliability Growth and Repairable System Analysis Reference.
Using the data in the following table, determine whether the standard Gompertz or modified Gompertz would be better suited for analyzing the given data.
| Stage | Reliability (%) |
|---|---|
| 0 | 36 |
| 1 | 38 |
| 2 | 46 |
| 3 | 58 |
| 4 | 71 |
| 5 | 80 |
| 6 | 86 |
| 7 | 88 |
| 8 | 90 |
| 9 | 91 |
Solution
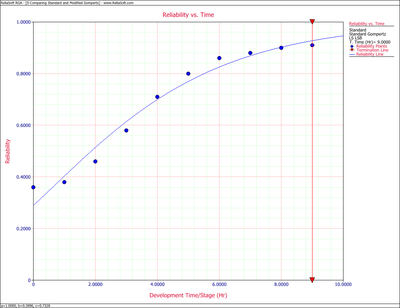
The standard Gompertz Reliability vs. Time plot is shown next.

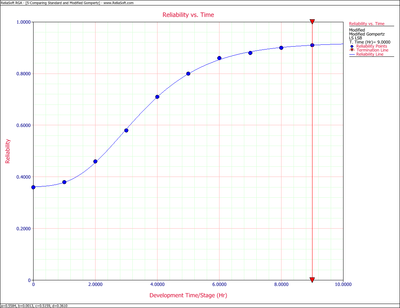
The standard Gompertz seems to do a fairly good job of modeling the data. However, it appears that it is having difficulty modeling the S-shape of the data. The modified Gompertz Reliability vs. Time plot is shown next. As expected, the modified Gompertz does a much better job of handling the S-shape presented by the data and provides a better fit for this data.
