Concurrent Operating Times - Crow-AMSAA (NHPP) Example
New format available! This reference is now available in a new format that offers faster page load, improved display for calculations and images and more targeted search.
As of January 2024, this Reliawiki page will not continue to be updated. Please update all links and bookmarks to the latest references at RGA examples and RGA reference examples.
This example appears in the Reliability Growth and Repairable System Analysis Reference book.
Six systems were subjected to a reliability growth test, and a total of 82 failures were observed. Given the data in the table below, which presents the start/end times and times-to-failure for each system, do the following:
- Estimate the parameters of the Crow-AMSAA model using maximum likelihood estimation.
- Determine how many additional failures would be generated if testing continues until 3,000 hours.
| System # | 1 | 2 | 3 | 4 | 5 | 6 |
| Start Time (Hr) | 0 | 0 | 0 | 0 | 0 | 0 |
| End Time (Hr) | 504 | 541 | 454 | 474 | 436 | 500 |
| Failure Times (Hr) | 21 | 83 | 26 | 36 | 23 | 7 |
| 29 | 83 | 26 | 306 | 46 | 13 | |
| 43 | 83 | 57 | 306 | 127 | 13 | |
| 43 | 169 | 64 | 334 | 166 | 31 | |
| 43 | 213 | 169 | 354 | 169 | 31 | |
| 66 | 299 | 213 | 395 | 213 | 82 | |
| 115 | 375 | 231 | 403 | 213 | 109 | |
| 159 | 431 | 231 | 448 | 255 | 137 | |
| 199 | 231 | 456 | 369 | 166 | ||
| 202 | 231 | 461 | 374 | 200 | ||
| 222 | 304 | 380 | 210 | |||
| 248 | 383 | 415 | 220 | |||
| 248 | 301 | |||||
| 255 | 422 | |||||
| 286 | 437 | |||||
| 286 | 469 | |||||
| 304 | 469 | |||||
| 320 | ||||||
| 348 | ||||||
| 364 | ||||||
| 404 | ||||||
| 410 | ||||||
| 429 |
Solution
1. To estimate the parameters [math]\displaystyle{ \hat{\beta }\,\! }[/math] and [math]\displaystyle{ \hat{\lambda}\,\! }[/math], the equivalent single system (ESS) must first be determined. The ESS is given below:
| Row | Time to Event (hr) | Row | Time to Event (hr) | Row | Time to Event (hr) | Row | Time to Event (hr) | |||
|---|---|---|---|---|---|---|---|---|---|---|
| 1 | 42 | 22 | 498 | 43 | 1386 | 64 | 2214 | |||
| 2 | 78 | 23 | 654 | 44 | 1386 | 65 | 2244 | |||
| 3 | 78 | 24 | 690 | 45 | 1386 | 66 | 2250 | |||
| 4 | 126 | 25 | 762 | 46 | 1386 | 67 | 2280 | |||
| 5 | 138 | 26 | 822 | 47 | 1488 | 68 | 2298 | |||
| 6 | 156 | 27 | 954 | 48 | 1488 | 69 | 2370 | |||
| 7 | 156 | 28 | 996 | 49 | 1530 | 70 | 2418 | |||
| 8 | 174 | 29 | 996 | 50 | 1530 | 71 | 2424 | |||
| 9 | 186 | 30 | 1014 | 51 | 1716 | 72 | 2460 | |||
| 10 | 186 | 31 | 1014 | 52 | 1716 | 73 | 2490 | |||
| 11 | 216 | 32 | 1014 | 53 | 1794 | 74 | 2532 | |||
| 12 | 258 | 33 | 1194 | 54 | 1806 | 75 | 2574 | |||
| 13 | 258 | 34 | 1200 | 55 | 1824 | 76 | 2586 | |||
| 14 | 258 | 35 | 1212 | 56 | 1824 | 77 | 2621 | |||
| 15 | 276 | 36 | 1260 | 57 | 1836 | 78 | 2676 | |||
| 16 | 342 | 37 | 1278 | 58 | 1836 | 79 | 2714 | |||
| 17 | 384 | 38 | 1278 | 59 | 1920 | 80 | 2734 | |||
| 18 | 396 | 39 | 1278 | 60 | 2004 | 81 | 2766 | |||
| 19 | 492 | 40 | 1278 | 61 | 2088 | 82 | 2766 | |||
| 20 | 498 | 41 | 1320 | 62 | 2124 | |||||
| 21 | 498 | 42 | 1332 | 63 | 2184 |
Given the ESS data, the value of [math]\displaystyle{ \hat{\beta }\,\! }[/math] is calculated using:
- [math]\displaystyle{ \hat{\beta }=\frac{n}{n\ln {{T}^{*}}-\underset{i=1}{\overset{n}{\mathop{\sum }}}\,\ln {{T}_{i}}}\,\! }[/math]
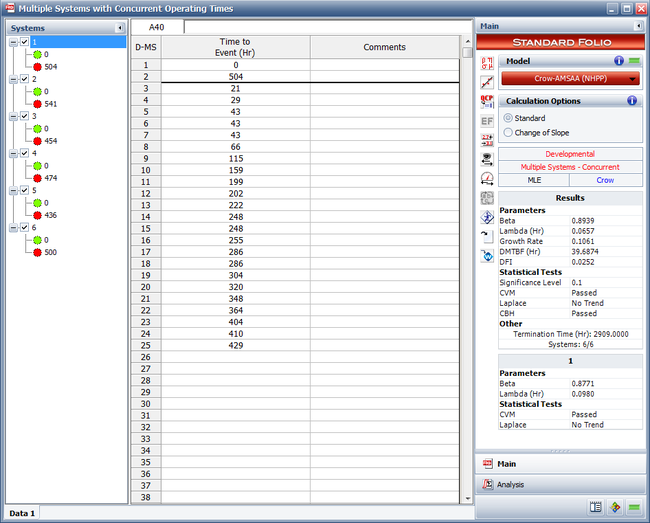
- [math]\displaystyle{ \hat{\beta }=0.8939\,\! }[/math]
where [math]\displaystyle{ n\,\! }[/math] is the number of failures and [math]\displaystyle{ T^*\,\! }[/math] is the termination time. The termination time is the sum of end times for each of the systems which equals 2909.
[math]\displaystyle{ \hat{\lambda}\,\! }[/math] is estimated with:
- [math]\displaystyle{ \hat{\lambda }=\frac{n}{{{T}^{*}}^{\beta }} }[/math]
- [math]\displaystyle{ \hat{\lambda }=0.0657\,\! }[/math]
The next figure shows the parameters estimated using RGA.

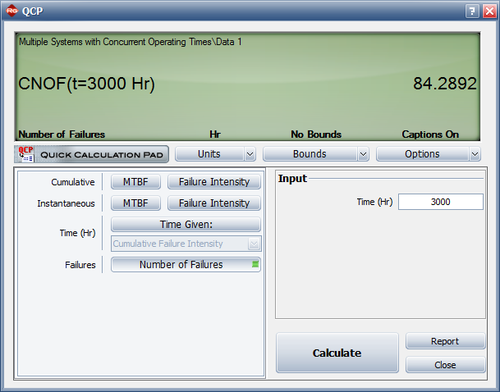
2. The number of failures can be estimated using the Quick Calculation Pad, as shown next. The estimated number of failures at 3,000 hours is equal to 84.2892 and 82 failures were observed during testing. Therefore, the number of additional failures generated if testing continues until 3,000 hours is equal to [math]\displaystyle{ 84.2892-82=2.2892\approx 3\,\! }[/math]

