Template:Example: Median Rank Plot Example
Jump to navigation
Jump to search
Median Rank Plot Example
In this example, we will determine the median rank value used for plotting the sixth failure from a sample size of ten. This will be used to illustrate two of the built-in functions in Weibull++'s Quick Statistical Reference.
Solution
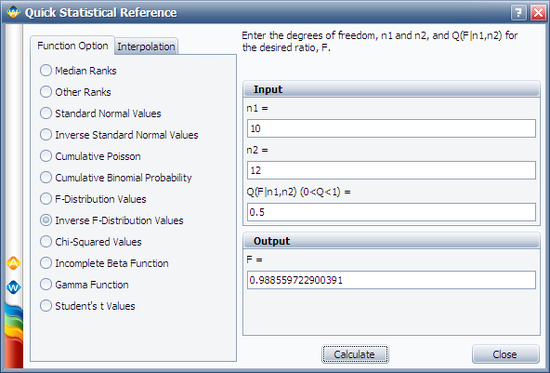
First, open the Quick Statistical Reference and select the Inverse F-Distribution Values option.
In this example, N = 10, j = 6, m = 2(10 - 6 + 1) = 10, and n = 2 x 6 = 12.
Thus, from the F-distribution rank equation:
- [math]\displaystyle{ MR=\frac{1}{1+\left( \frac{10-6+1}{6} \right){{F}_{0.5;10;12}}} }[/math]
Use the QSR to calculate the value of F0.50;10;12 = 0.9886, as shown next:
Consequently:
- [math]\displaystyle{ MR=\frac{1}{1+\left( \frac{5}{6} \right)\times 0.9886}=0.5483=54.83% }[/math]
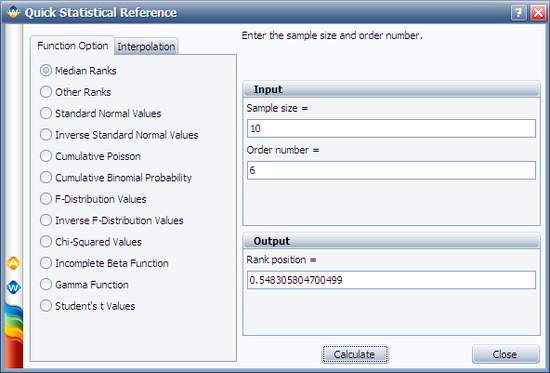
Another method is to use the Median Ranks option directly, which yields MR(%) = 54.8305%, as shown next:

