BlockSim Example: CM Triggered by Subsystem Down
 |
New format available! This reference is now available in a new format that offers faster page load, improved display for calculations and images and more targeted search.
As of January 2024, this Reliawiki page will not continue to be updated. Please update all links and bookmarks to the latest references at BlockSim examples and BlockSim reference examples.
This example illustrates how to model the case when corrective maintenance is triggered by the failure of a subsystem. We present two methods: one without a subdiagram and one with a subdiagram. The limitation of the method without a subdiagram is that it cannot model a subsystem with more than two devices in parallel or a more complex structure. The method with a subdiagram is free of this limitation.
Method 1: Without subdiagram
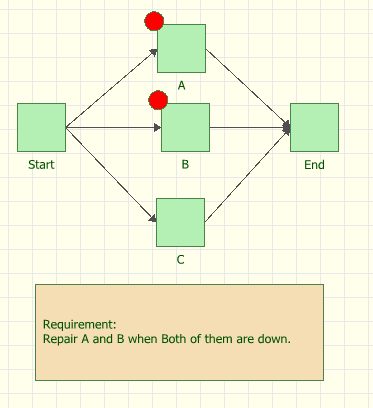
Consider a system with three devices, A, B and C, in parallel. A and B form a subsystem, AB. If both A and B fail (i.e., if subsystem AB fails), then start to repair A and B. Device C is in parallel with subsystem AB. The repair of C depends on its failure. When C fails, then start to repair C.
BlockSim Solution
The BlockSim modeling of this system is shown in the figure below.

- The reliability of all blocks follows a Weibull distribution with Beta = 1.5 and Eta = 500 hours.
- Block A and Block B belong to maintenance group MG_AB.
- The corrective maintenance of Block A and Block B are set to "When found failed during an inspection." The corrective maintenance duration is 120 hours. Upon repair, they are as good as new.
- An inspection is set up for both Blocks A and B. The inspection is performed based on events in maintenance group MG_AB. If any of the blocks in the maintenance group fail or if corrective maintenance starts for any of them, then the inspection is performed. The inspection duration is set to "Immediate Repair" and upon inspection; the device is restored to same as it was when it failed (i.e., as bad as old).
- The corrective maintenance of Block C is performed upon failure of Block C and the duration is 20 hours. It is as good as new upon repair.
Block Up/Down plot
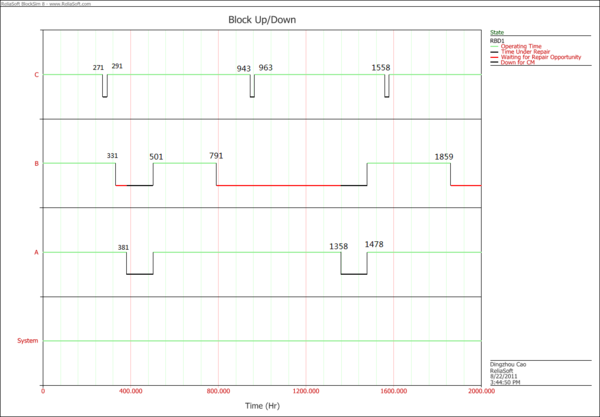
The system event log is shown in the figure below and explained next:
- At 271 hours, Block C fails and the repair is finished at 291 hours.
- At 331 hours, Block B fails. Since the subsystem AB is not down (if both A and B fails, then subsystem AB fails), Block B is waiting for repair. (The failure of Block B cannot trigger an inspection of Block B, but this failure would trigger the inspection of Block A. However, Block A has not failed at this time, thus nothing happens).
- At 381 hours, Block A fails and subsystem AB fails. The failure of the subsystem triggers the inspection and then inspection triggers corrective maintenance. (The failure of Block A triggers an inspection on Block B, which is currently failied. Thus corrective maintenance of Block B is performed. Performing corrective maintenance on Block B triggers the inspection of Block A. Since Block A is also currently failed, thus corrective maintenance of Block A is performed too.)
- At 501 hours, both Block A and B are restored.
- At 791 hours, Block B fails and is waiting for repair.
- At 943 hours, Block C fails and is restored at 963 hours.
- At 1358 hours, Block A fails and subsystem AB fails, triggering corrective maintenance for Block A and B.
- At 1478 hours, both Block A and B are restored.
- ...

Method 2: With subdiagram
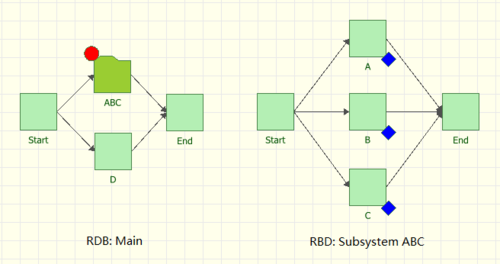
Now consider a system consisting of four devices A, B, C and D. Devices A, B and C are in a parallel structure and form a subsystem, ABC. If all of A, B and C fail (i.e, if subsystem ABC fails), then start to repair devices A, B and C. Device D is parallel with subsystem ABC. The repair of D depends on its failure. When D fails, then start to repair D. Method 1 cannot model this system. Here we use a subdiagram to model the subsystem.
BlockSim Solution
The BlockSim model of this system is shown in the figure below.

By using a subdiagram, we can break the limitation in method 1.
- The reliability of all blocks follows a Weibull distribution with Beta = 1.5 and Eta = 100 hours.
- The subdiagram block ABC belongs to maintenance group MG_ABC.
- The corrective maintenance of Blocks A, B and C are set to "When found failed during an inspection." The corrective maintenance duration is 20 hours. Upon repair, they are as good as new.
- An inspection is set up for Blocks A, B and C. The inspection is performed based on events in maintenance group MG_ABC. If any of the blocks in the maintenance group fail or if corrective maintenance starts for any of them, then the inspection is performed. The inspection duration is 30 hours. Upon inspection, the device is restored to the same condition it was in prior to the inspection (i.e., as bad as old).
- The corrective maintenance of Block D is performed upon the failure of Block D and the duration is 40 hours. It is as good as new upon repair.
Block Up/Down plot
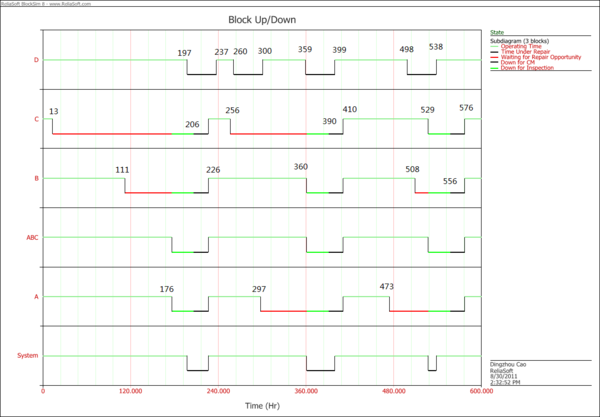
The system event log is shown in the figure below and explained next:
- At 13 hours, Block C fails. Since subsystem ABC doesn't fail, Block C waits for repair.
- At 111 hours, Block B fails. Since subsystem ABC doesn't fail, Block B waits for repair.
- At 176 hours, Block A fails and brings down the subsystem ABC. The failure of subsystem ABC triggers the inspection of Blocks A, B and C.
- At 197 hours, Block D fails and is repaired at 237 hours.
- At 206 hours, inspection on Blocks A, B and C is complete. It triggers corrective maintenance on all three blocks.
- At 226 hours, Blocks A, B and C are restored.
- ...
