Template:Webull++ Warranty Dates Format Example
Warranty Data Analysis Dates Format Example
Assume a company has the following information for a product.
Sales
| Quantity In-Service | Date In-Service |
| 6316 | 1/1/2010 |
| 8447 | 2/1/2010 |
| 5892 | 3/1/2010 |
| 596 | 4/1/2010 |
| 996 | 5/1/2010 |
| 8977 | 6/1/2010 |
| 2578 | 7/1/2010 |
| 8318 | 8/1/2010 |
| 2667 | 9/1/2010 |
| 7452 | 10/1/2010 |
| 1533 | 11/1/2010 |
| 9393 | 12/1/2010 |
| 1966 | 1/1/2011 |
| 8960 | 2/1/2011 |
| 6341 | 3/1/2011 |
| 4005 | 4/1/2011 |
| 3784 | 5/1/2011 |
| 5426 | 6/1/2011 |
| 4958 | 7/1/2011 |
| 6981 | 8/1/2011 |
Returns
| Quantity Returned | Date of Return | Date In-Service |
| 2 | 10/29/2010 | 10/1/2010 |
| 1 | 11/13/2010 | 10/1/2010 |
| 2 | 3/15/2011 | 10/1/2010 |
| 5 | 4/10/2011 | 10/1/2010 |
| 1 | 11/13/2010 | 11/1/2010 |
| 2 | 2/19/2011 | 11/1/2010 |
| 1 | 3/11/2011 | 11/1/2010 |
| 2 | 5/18/2011 | 11/1/2010 |
| 1 | 1/9/2011 | 12/1/2010 |
| 2 | 2/13/2011 | 12/1/2010 |
| 1 | 3/2/2011 | 12/1/2010 |
| 1 | 6/7/2011 | 12/1/2010 |
| 1 | 4/28/2011 | 1/1/2011 |
| 2 | 6/15/2011 | 1/1/2011 |
| 3 | 7/15/2011 | 1/1/2011 |
| 1 | 8/10/2011 | 2/1/2011 |
| 1 | 8/12/2011 | 2/1/2011 |
| 1 | 8/14/2011 | 2/1/2011 |
Future Sales
| Quantity In-Service | Date In-Service |
| 5000 | 9/1/2011 |
| 5000 | 10/1/2011 |
| 5000 | 11/1/2011 |
| 5000 | 12/1/2011 |
| 5000 | 1/1/2012 |
Using the above information, we want to estimate the failure distribution of this product and forecast warranty returns.
Solution
Step 1: The data can be entered into a Warranty folio with Dates Format. They are given in the figures below.
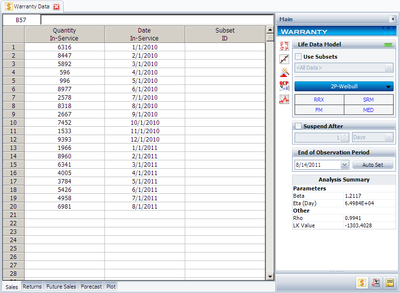
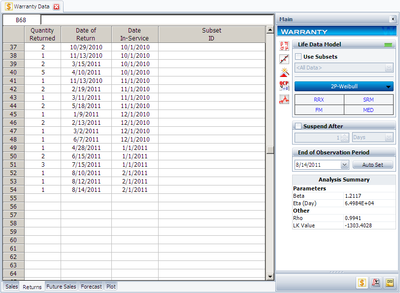
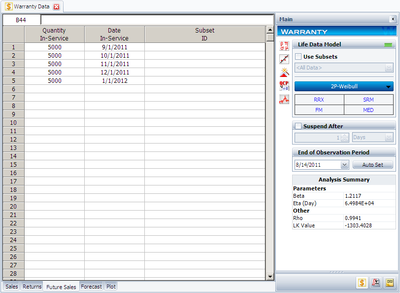
Step 2: Set the calculation setting as:
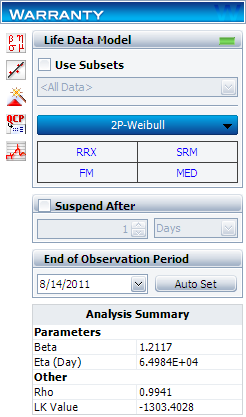
Please make sure the End of Observation Period to be 8/14/2011.
Step 3: Click on Calculate Button, you get the results shown in the Analysis Summary in the above figure. You also click on the Analysis Summary to view more results.
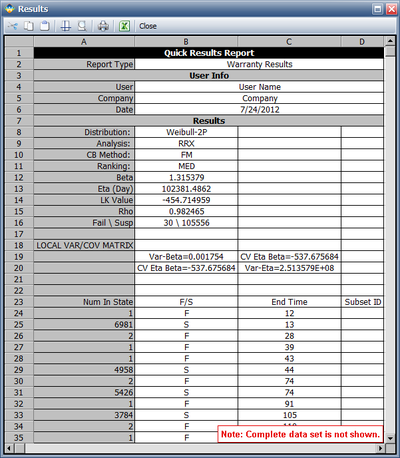
In the bottom part of the above figure, you can see the warranty data is converted to data format that can be used in standard Weibull++ folio.
Step 4: Click on the Forecast button

] to get the following forecast window.
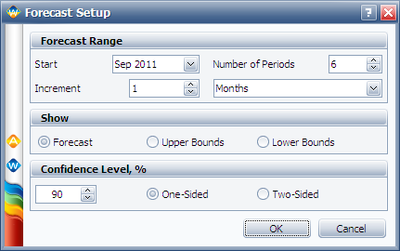
Click on OK to get the forecast return for the future months. Please remember, the current time was set to 8/14/2011.
Step 5: Click on the plot button, and choose the Expected Failures plot. The predicted number of returns for each month was plotted.
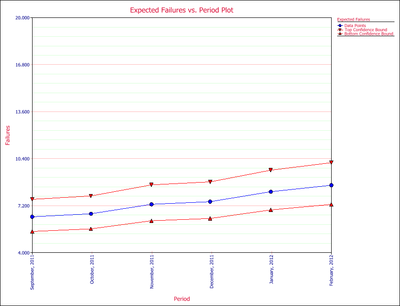
The rest plots in the plot type drop down list are the same plots as in Webull++ standard folio.