Template:Example: Published 2P Weibull Distribution Suspension Data MLE Example
Published 2P Weibull Distribution Suspension Data MLE Example
From Wayne Nelson, Fan Example, Applied Life Data Analysis, page 317 [30].
Seventy diesel engine fans accumulated 344,440 hours in service and twelve of them failed. A table of their life data is shown next (+ denotes non-failed units or suspensions, using Dr. Nelson's nomenclature). Evaluate the parameters with their two-sided 95% confidence bounds, using MLE for the two-parameter Weibull distribution.
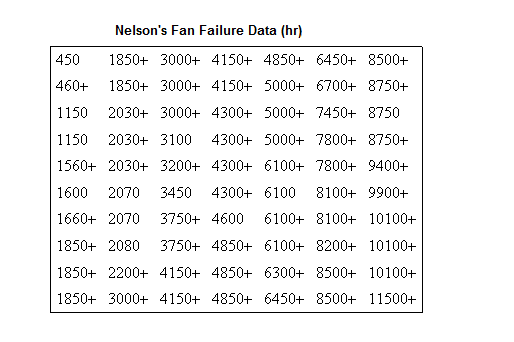
Published Results:
Weibull parameters (2P-Weibull, MLE):

Published 95% FM confidence limits on the parameters:

Published variance/covariance matrix:
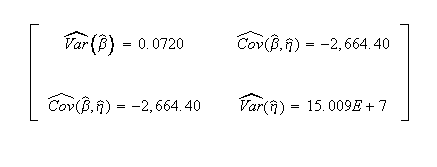
Note that Nelson expresses the results as multiples of 1000 (or = 26.297, etc.). The published results were adjusted by this factor to correlate with Weibull++ results.
Computed Results in Weibull++
This same data set can be entered into Weibull++ by selecting the data sheet Times to Failure, with Right Censored Data (Suspensions) and I want to enter data in groups (in order to group identical values) options, and using two-parameter Weibull and MLE to calculate the parameter estimates.
You can also enter the data as given in Table without grouping them by opening a Data Sheet with Times to Failure and the with Right Censored Data (Suspensions) options. Then click the Group Data icon and chose Group exactly identical values.

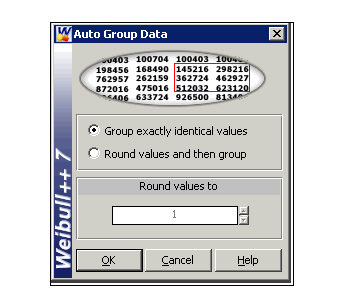
The data will be automatically grouped and put into a new grouped data sheet.
Weibull++ computed parameters for maximum likelihood are:
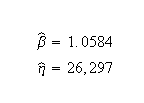
Weibull++ computed 95% FM confidence limits on the parameters:

Weibull++ computed/variance covariance matrix:

The two-sided 95% bounds on the parameters can be determined from the QCP, in the Parameter Bounds tab.
