Template:Example: Published 2P Weibull Distribution Interval Data MLE Example
Published 2P Weibull Distribution Interval Data MLE Example
From Wayne Nelson, Applied Life Data Analysis, Page 415 [30]. One hundred and sixty-seven (167) identical parts were inspected for cracks. The following is a table of their last inspection times and times-to-failure:
Published Results:
Published results (using MLE):
Published 95% FM confidence limits on the parameters:
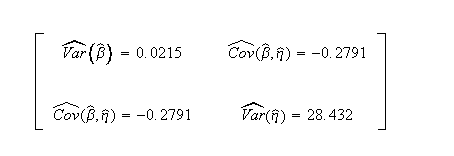
Published variance/covariance matrix:
Computed Results in Weibull++
This same data set can be entered into Weibull++ by selecting the data sheet Times to Failure, with Right Censored Data (Suspensions), with Interval and Left Censored Data and with Grouped Observations options, and using MLE.
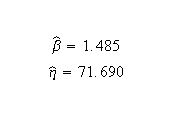
Weibull++ computed parameters for maximum likelihood are:
Weibull++ computed 95% FM confidence limits on the parameters:
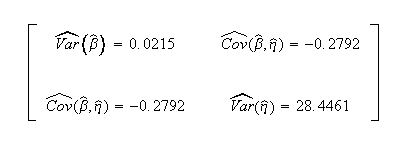
Weibull++ computed/variance covariance matrix:


