Template:Using the mixed weibull distribution in Weibull++
Using the Mixed Weibull Distribution in Weibull++
To use the mixed Weibull distribution, simply select the Mixed option under Parameters/Type, and click the Calculate icon. A window will appear asking you which form of the mixed Weibull you would like to use, i.e. S = 2, 3 or 4. In other words, How many subpopulations would you like to consider?
Simply select the number of subpopulations you would like to consider and click OK. The application will automatically calculate the parameters of each subpopulation for you.
Viewing the Calculated Parameters
When using the Mixed Weibull option, the parameters given in the result area apply to different subpopulations. To view the results for a particular subpopulation, select the subpopulation, as shown next.
About the Calculated Parameters
Weibull++ uses the numbers 1, 2, 3 and 4 (or first, second, third and fourth subpopulation) to identify each subpopulation. These are just designations for each subpopulation, and they are ordered based on the value of the scale parameter, [math]\displaystyle{ \eta }[/math] . Since the equation used is additive or:
- [math]\displaystyle{ {{R}_{1,..,S}}(T)=\underset{i=1}{\overset{S}{\mathop \sum }}\,\frac{{{N}_{i}}}{N}{{e}^{-{{\left( \tfrac{t}{{{\eta }_{i}}} \right)}^{{{\beta }_{i}}}}}} }[/math]
the order of the subpopulations which are given the designation 1, 2, 3, or 4 is of no consequence. For consistency, the application will always return the order of the results based on the magnitude of the scale parameter.
Example 1:
We will illustrate the mixed Weibull analysis using a Monte Carlo generated set of data. To repeat this example, generate data from a 2-parameter Weibull distribution using the Weibull++ Monte Carlo utility. The following figures illustrate the required steps, inputs and results.
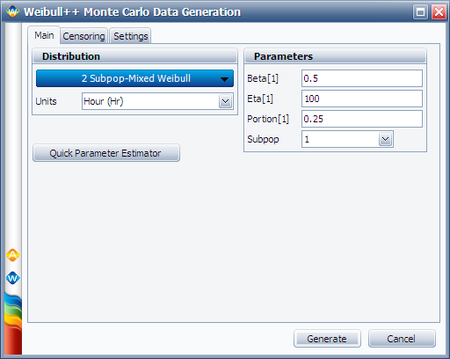
In the Monte Carlo window, enter the values and select the options shown below for subpopulation 1.
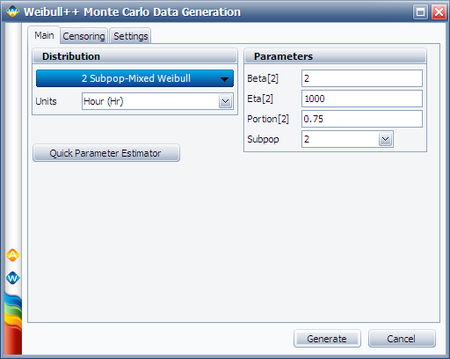
Switch to subpopulation 2 and make the selection shown below. Click Generate.
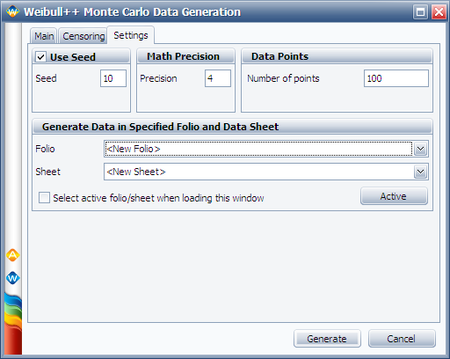
The simulation settings are:
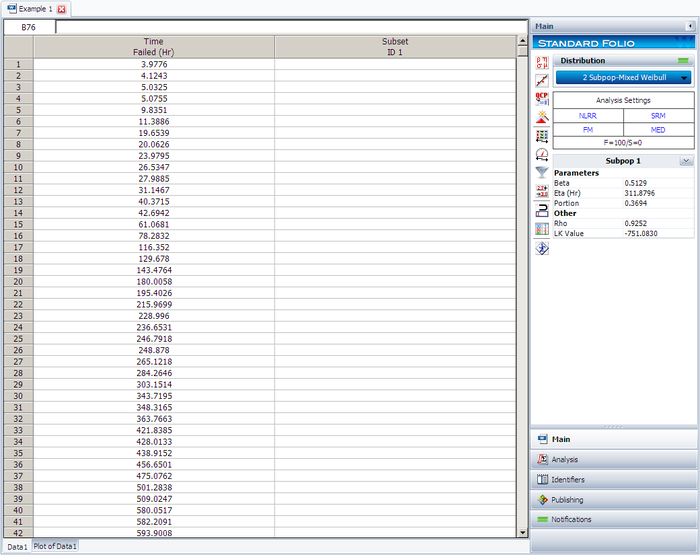
After the data set has been generated, choose the 2 Subpop-Mixed Weibull distribution. Click Calculate.
The results for subpopulation 1 are shown next. (Note that your results could be different due to the randomness of the simulation.)
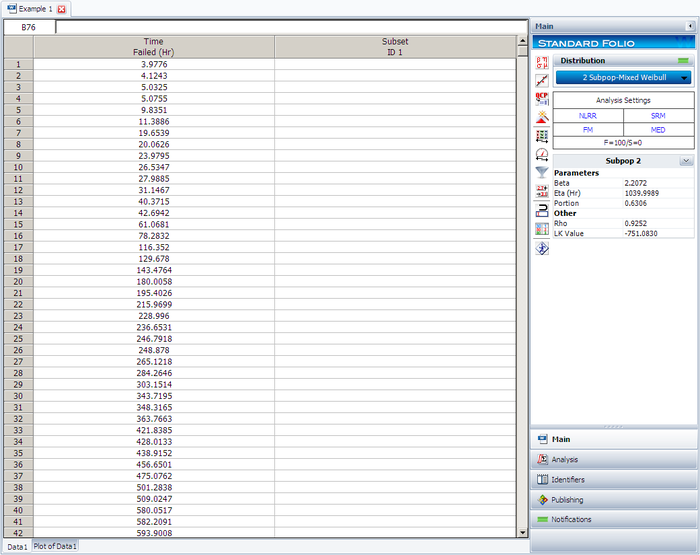
The results for subpopulation 2 are shown next. (Note that your results could be different due to the randomness of the simulation.)
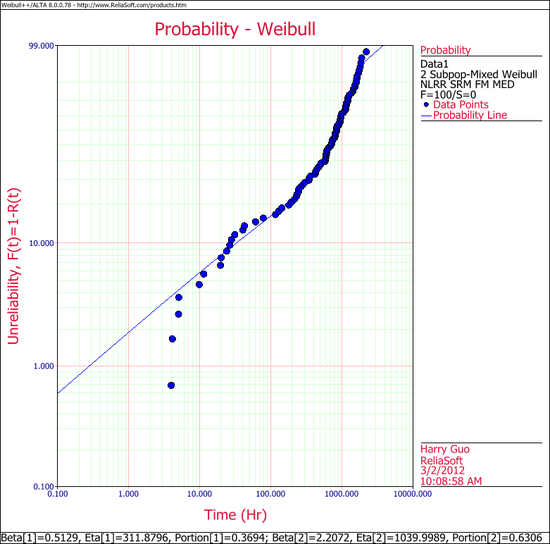
The Weibull probability plot for this data is shown next. (Note that your results could be different due to the randomness of the simulation.)

