Uncategorized files
Jump to navigation
Jump to search
Showing below up to 50 results in range #2,951 to #3,000.
 Transfer2fol.png 973 × 624; 67 KB
 Transferdata2folio.png 441 × 117; 19 KB
 TransitionMatrixExp.jpg 368 × 144; 8 KB
 Two-sided-bounds.gif 390 × 238; 3 KB
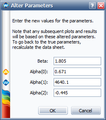 Two Stress GLL Weibull Alter Parameters.png 261 × 295; 15 KB
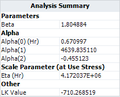 Two Stress GLL Weibull Analysis Summary GLL.png 211 × 171; 6 KB
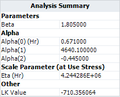 Two Stress GLL Weibull Analysis Summary GLL new alpha.png 211 × 171; 6 KB
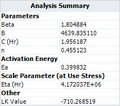 Two Stress GLL Weibull Analysis Summary TNT.png 211 × 186; 6 KB
 Two Stress GLL Weibull Eta.png 211 × 31; 2 KB
 Two Stress GLL Weibull Parameter Bounds.png 568 × 297; 26 KB
 Two Stress GLL Weibull QPC Reliability.png 609 × 478; 70 KB
 Two Stress GLL Weibull Stress Transform.png 478 × 157; 17 KB
 Two level anova.png 615 × 203; 11 KB
 Two level responses.png 555 × 253; 7 KB
 Two sided bounds.png 500 × 417; 24 KB
 Under-Construction.gif 806 × 806; 107 KB
 UnderC.png 125 × 129; 9 KB
 Underconstruction.png 400 × 400; 106 KB
 Underterms.png 834 × 37; 20 KB
 Unreliability VS Time.png 1,150 × 800; 67 KB
 Updown item age.png 408 × 61; 736 bytes
 Updown system age.png 431 × 60; 739 bytes
 Usage Example In-Service Raw Data.png 269 × 223; 5 KB
 Usage Example Reliability Plot.png 872 × 667; 31 KB
 Usage Example Return Raw Data.png 386 × 257; 8 KB
 Usage Example Weibull Std Folio Data.png 764 × 626; 68 KB
 Usage In-Service Weibull Data.png 682 × 600; 58 KB
 Usage Return Data.png 682 × 412; 48 KB
 Usage Return Weibull Data.png 682 × 600; 62 KB
 Usage Suspension Allocation.PNG 500 × 615; 43 KB
 Usage lognormal pdf.png 1,150 × 800; 69 KB
 Usage pdf Plot.gif 600 × 582; 17 KB
 Usage pdf Plot.png 500 × 586; 14 KB
 Usagedistribution.png 250 × 526; 24 KB
 Usageformat.png 626 × 431; 26 KB
 Usageformat1.png 753 × 550; 44 KB
 Use stress vs high stress.png 500 × 442; 26 KB
 Use v high stress.png 500 × 354; 26 KB
 Uselevelpdf.PNG 348 × 360; 17 KB
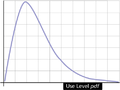 Uselevelpdf.png 500 × 373; 21 KB
 Userguide.png 125 × 157; 7 KB
 VoW.png 730 × 499; 49 KB
 Volts.png 895 × 430; 40 KB
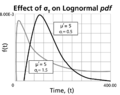 WB.10 effect of sigma.png 1,000 × 790; 38 KB
 WB.10 lognormal contour plot.png 500 × 385; 18 KB
 WB.10 lognormal pdf.png 1,000 × 734; 36 KB
 WB.10 lpp2.png 500 × 444; 113 KB
 WB.10 lpp3.png 500 × 513; 114 KB
 WB.10 reliability v sigma.png 500 × 278; 20 KB
 WB.10 time vs sigma.png 500 × 313; 19 KB


