Uncategorized files
Jump to navigation
Jump to search
Showing below up to 50 results in range #2,251 to #2,300.
-
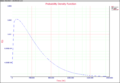
 Optimum replacement.png 798 × 232; 27 KB
-
 Orion online.png 90 × 90; 10 KB
-
 Oval.gif 90 × 54; 1 KB
-
 Oval.png 500 × 228; 11 KB
-
 Ovalplot.gif 530 × 285; 4 KB
-
 Overlay plot.png 474 × 630; 19 KB
-
 Overlay plot - PDF.png 1,150 × 800; 70 KB
-
 Overlay plot - Reliability vs Time.png 1,150 × 800; 67 KB
-
 PDF.png 1,150 × 800; 67 KB
-
 PantelisVassiliou.jpg 307 × 318; 19 KB
-
 Parallel allocation.png 250 × 435; 25 KB
-
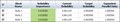 Parallel allocationresult.png 572 × 104; 9 KB
-
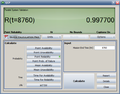
 Parallel qcp.png 609 × 478; 58 KB
-
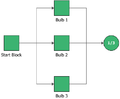 Parallel rbd.png 380 × 314; 5 KB
-
 Parallel sim.png 548 × 523; 64 KB
-
 Parallel simqcp.png 609 × 478; 62 KB
-
 Param RDT.png 668 × 481; 47 KB
-
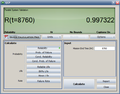
 ParameterQCP.png 928 × 480; 70 KB
-
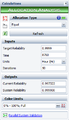
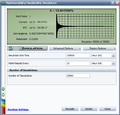
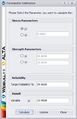 Parameter estimator.jpg 317 × 491; 45 KB
-
 Parameterbug.gif 250 × 231; 8 KB
-
 Parameterweibull.png 207 × 28; 2 KB
-
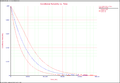 Parametric RDA Cond R(T) plot.png 1,150 × 800; 39 KB
-
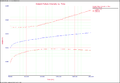 Parametric RDA Lambda(T) plot.png 1,150 × 800; 37 KB
-
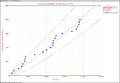 Parametric RDA N(T) plot.png 1,150 × 800; 45 KB
-
 Pdf2.png 500 × 376; 18 KB
-
 Pdf2d.gif 650 × 618; 16 KB
-
 Pdf2d.png 500 × 387; 30 KB
-
 Pdf3d.gif 1,594 × 1,194; 176 KB
-
 Pdf cdf.png 800 × 599; 13 KB
-
 Pdf cdf2.png 630 × 839; 23 KB
-
 Pdf lifestress1.png 500 × 391; 121 KB
-
 Pdfdownload.png 233 × 216; 43 KB
-
 Pdfnlifestress.png 3,602 × 2,819; 359 KB
-
 Pdfvstimeandstress.png 381 × 352; 38 KB
-
 Pentagon.gif 95 × 81; 1 KB
-
 Pentagon.png 500 × 431; 9 KB
-
 Phase Example 1.png 500 × 414; 34 KB
-
 Phase Example 2.png 645 × 562; 69 KB
-
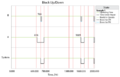 Phase Up Down plot for Example 1.png 500 × 319; 9 KB
-
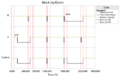 Phase Up Down plot for Example 2.png 500 × 319; 9 KB
-
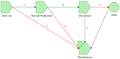 Phase diagram for oil refinery.png 580 × 283; 12 KB
-
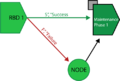 Phase node block.png 500 × 338; 31 KB
-
 Phase stop block.png 500 × 342; 24 KB
-
 Phase subdigram Up Down plot.png 500 × 319; 8 KB
-
 Plackett burman anova.png 463 × 322; 11 KB
-
 Plackett burman equation.png 166 × 238; 5 KB
-
 Plainspreadsheet.png 643 × 504; 19 KB
-
 PlannedResourceLoadingScreenShot.png 1,168 × 239; 35 KB
-
 Plot Type Contour plot.png 784 × 617; 20 KB
-
 Plot Type Data and Results.png 847 × 554; 49 KB


_plot.png)
_plot.png)
_plot.png)


