Template:Standby with Delay (SCT Solution)
SCT with delay
Purposes
The purposes of this example is to illustrate how to apply SCT with delay.
Description
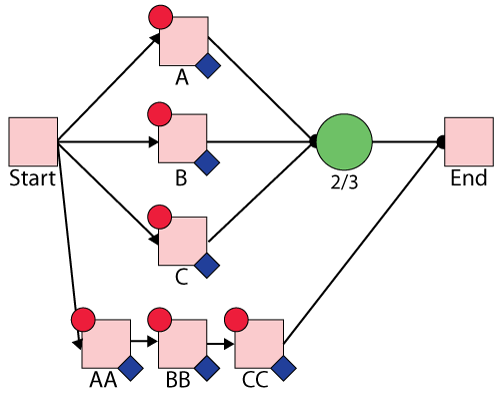
Three devices A, B and C are in parallel. 2 out of 3 are required to perform the task. Initially A and B are working, C is in standby status. If A or B fails, C will replace the failed one with some delay. After the failed device is restored, it will become a standby device. For example, If A fails, with 10 hours delay C will become active and replace A. After A is restored, it will become a standby device for B and C.
BlockSim Solution
The BlockSim modeling of this system is shown in Figure below.

In order to model the delay, three extra blocks AA, BB and CC are added to the diagram. Each of them fails every 10 hours (Normal distribution with mean 10 hours and standdard deviaiotn 0.0000001 hours). They operate even if system is down and repair durations for them are 0 (immediate repair). Block AA(BB/CC) is belong to maintenance group AA(BB/CC). They all have state change triggers. The initial state is OFF and the state upon repair is Always OFF. If Block A (B/C) goes down, then activate Block AA (BB/CC).
Block A fails every 100 hours. It is belong to maintenance gruop A. It has state change triggers. The intial state is ON; the state upon repair is Default OFF unless SCT overridden. If Block BB or Block CC goes down, active this block.
Block B fails every 200 hours. It is belong to maintenance gruop B. It has state change triggers. The intial state is ON; the state upon repair is Default OFF unless SCT overridden. If Block AA or Block CC goes down, active this block.
Block C fails every 300 hours. It is belong to maintenance gruop C. It has state change triggers. The intial state is OFF; the state upon repair is Default OFF unless SCT overridden. If Block BB or Block CC goes down, active this block.
The repair duration for Block A, B and C follows Normal distribution with mean 30 hours and standard deviation 0.000001.
Block Up/Down plot
The system event log is shown in Figure belwo and is as follows:
- At 100, Block A fails, and activates Block AA.