ALTA Test Plan Example
New format available! This reference is now available in a new format that offers faster page load, improved display for calculations and images and more targeted search.
As of January 2024, this Reliawiki page will not continue to be updated. Please update all links and bookmarks to the latest references at ALTA examples and ALTA reference examples.
This example appears in the Accelerated Life Testing Data Analysis Reference book.
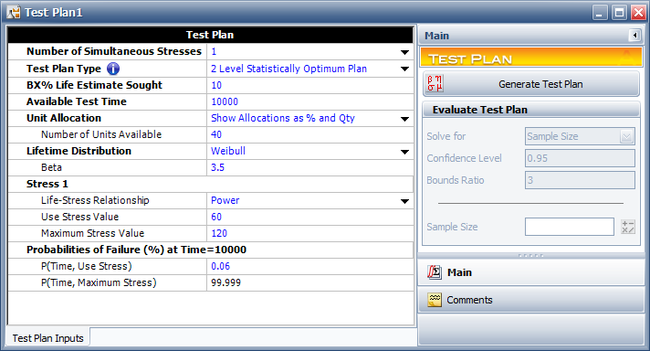
A reliability engineer is planning an accelerated test for a mechanical component. Torque is the only factor in the test. The purpose of the experiment is to estimate the B10 life (time equivalent to unreliability = 0.1) of the diodes. The reliability engineer wants to use a 2 Level Statistically Optimum Plan because it would require fewer test chambers than a 3 level test plan. 40 units are available for the test. The mechanical component is assumed to follow a Weibull distribution with beta = 3.5, and a power model is assumed for the life-stress relationship. The test is planned to last for 10,000 cycles. The engineer has estimated that there is a 0.06% probability that a unit will fail by 10,000 cycles at the use stress level of 60 N · m. The highest level allowed in the test is 120 N · m and a unit is estimated to fail with a probability of 99.999% at 120 N · m. The following setup shows the test plan in ALTA.
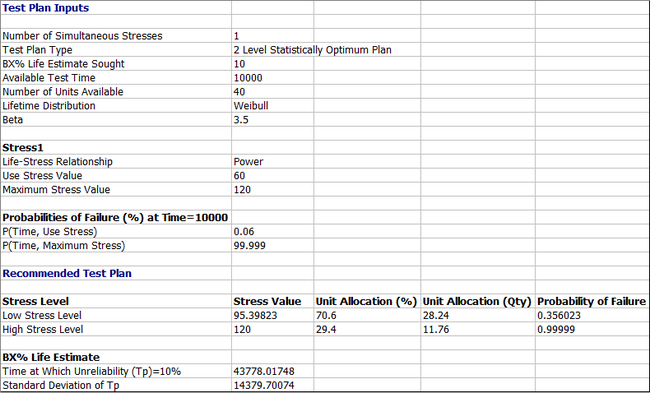
The Two Level Statistically Optimum Plan is shown next.
The Two Level Statistically Optimum Plan is to test 28.24 units at 95.39 N · m and 11.76 units at 120 N · m. The variance of the test at B10 is [math]\displaystyle{ Var({{T}_{p}}=B10)=StdDev{{({{T}_{p}}=B10)}^{2}}={{14380}^{2}} }[/math].
Test Plan Evaluation
In addition to assessing [math]\displaystyle{ Var({{\hat{T}}_{p}}) }[/math], the test plan can also be evaluated based on three different criteria: confidence level, bounds ratio or sample size. These criteria can be assessed before conducting the recommended test to decide whether the test plan is satisfactory or whether some modifications would be beneficial. We can solve for any one of three criteria, given the two other criteria.
The bounds ratio is defined as follows:
- [math]\displaystyle{ \text{Bounds Ratio}=\frac{\text{Two Sided Upper Bound on }{{T}_{p}}}{\text{Two Sided Lower Bound on }{{T}_{p}}} }[/math]
This ratio is analogous to the ratio that can be calculated if a test is conducted and life data are obtained and used to calculate the ratio of the confidence bounds based on the results.
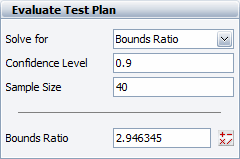
For this example, assume that a 90% confidence is desired and 40 units are to be used in the test. The bounds ratio is calculated as 2.946345, as shown next.
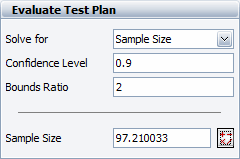
If this calculated bounds ratio is unsatisfactory, we can calculate the required number of units that would meet a certain bounds ratio criterion. For example, if a bounds ratio of 2 is desired, the required sample size is calculated as 97.210033, as shown next.
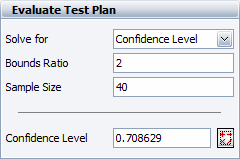
If the sample size is kept at 40 units and a bounds ratio of 2 is desired, the equivalent confidence level we have in the test drops to 70.8629%, as shown next.

