Template:Example: Stress-Strength Analysis with Parameter Uncertainty
Stress-Strength Analysis with Parameter Uncertainty
Assume we are going to use stress-strength analysis to estimate the reliability of a component used in a vehicle. The stress is the usage mileage distribution and the strength is the miles-to-failure distribution of the component. The warranty is 1 year or 15,000 miles, whichever is earlier. This table gives the data for the mileage distribution per year (stress):
| Stress: Usage Mileage Distribution | |
| 10096 | 12405 |
| 10469 | 12527 |
| 10955 | 12536 |
| 11183 | 12595 |
| 11391 | 12657 |
| 11486 | 13777 |
| 11534 | 13862 |
| 11919 | 13971 |
| 12105 | 14032 |
| 12141 | 14138 |
This table gives the data for the miles-to-failure distribution (strength):
| Strength: Failure Mileage Distribution | |
| 13507 | 16125 |
| 13793 | 16320 |
| 13943 | 16327 |
| 14017 | 16349 |
| 14147 | 16406 |
| 14351 | 16501 |
| 14376 | 16611 |
| 14595 | 16625 |
| 14746 | 16670 |
| 14810 | 16749 |
| 14940 | 16793 |
| 14951 | 16862 |
| 15104 | 16930 |
| 15218 | 16948 |
| 15303 | 17024 |
| 15311 | 17041 |
| 15480 | 17263 |
| 15496 | 17347 |
| 15522 | 17430 |
| 15547 | 17805 |
| 15570 | 17884 |
| 15975 | 18549 |
| 16003 | 18575 |
| 16018 | 18813 |
| 16052 | 18944 |
The goal is to estimate the reliability of the component within the warranty period (1 year/15,000 miles).
Solution
First, we need to estimate the stress and strength distributions using the above data. The estimated stress distribution is:
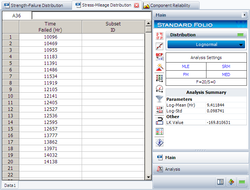
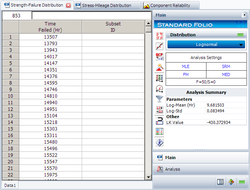
The estimated strength distribution is:
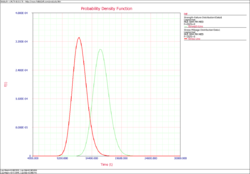
Then we open the Stress-Strength tool and choose to compare the two data sheets. The following picture shows the pdf curves of the two data sets:
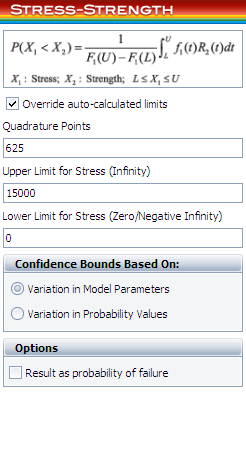
Since the warranty is 1 year/15,000 miles, all the vehicles with mileage larger than 15,000 should not be considered in the calculation. This is done by using the following settings in the tool:
The calculated results are:
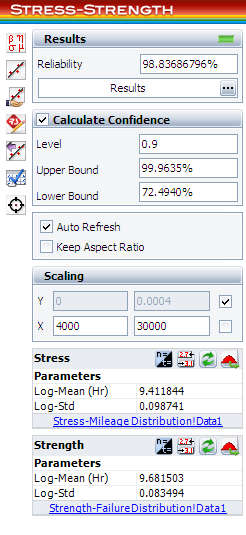
The estimated reliability for vehicles less than 15,000 miles per year is 98.84%. The associated confidence bounds are estimated from the variance of the distribution parameters. With larger samples for the stress and strength data, the width of the bounds will be narrower.