Template:Example: Stress-Strength Analysis with Parameter Uncertainty
Stress-Strength Analysis with Parameter Uncertainty
Assume we are going to use stress-strength analysis to estimate the reliability of a component used in a vehicle. The stress is the usage mileage distribution and the strength is the miles-to-failure distribution of the component. The warranty is 1 year or 15,000 miles, whichever is earlier. This table gives the data for the mileage distribution per year (stress):
| Stress: Usage Mileage Distribution | |
| 10096 | 12405 |
| 10469 | 12527 |
| 10955 | 12536 |
| 11183 | 12595 |
| 11391 | 12657 |
| 11486 | 13777 |
| 11534 | 13862 |
| 11919 | 13971 |
| 12105 | 14032 |
| 12141 | 14138 |
This table gives the data for the miles-to-failure distribution (strength):
| Strength: Failure Mileage Distribution | |
| 13507 | 16125 |
| 13793 | 16320 |
| 13943 | 16327 |
| 14017 | 16349 |
| 14147 | 16406 |
| 14351 | 16501 |
| 14376 | 16611 |
| 14595 | 16625 |
| 14746 | 16670 |
| 14810 | 16749 |
| 14940 | 16793 |
| 14951 | 16862 |
| 15104 | 16930 |
| 15218 | 16948 |
| 15303 | 17024 |
| 15311 | 17041 |
| 15480 | 17263 |
| 15496 | 17347 |
| 15522 | 17430 |
| 15547 | 17805 |
| 15570 | 17884 |
| 15975 | 18549 |
| 16003 | 18575 |
| 16018 | 18813 |
| 16052 | 18944 |
The goal is to estimate the reliability of the component within the warranty period (1 year/15,000 miles).
Solution
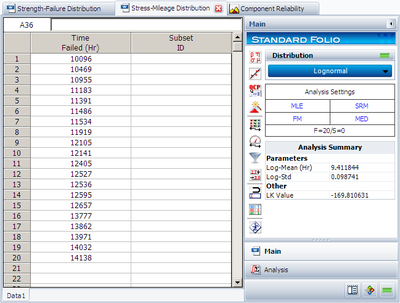
First, we need to estimate the stress and strength distributions using the above data. The estimated stress distribution is:
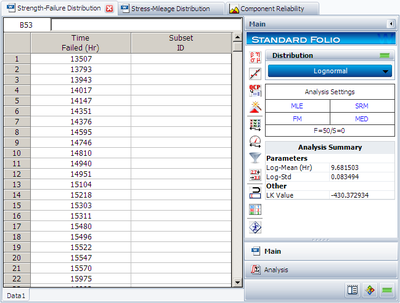
The estimated strength distribution is:
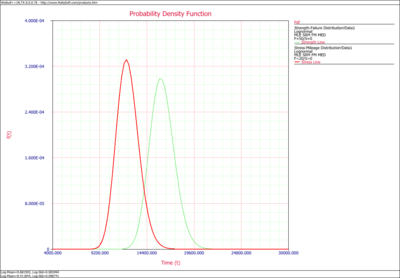
Open the Stress-Strength tool and choose to compare the two data sheets. The following picture shows the pdf curves of the two data sets:
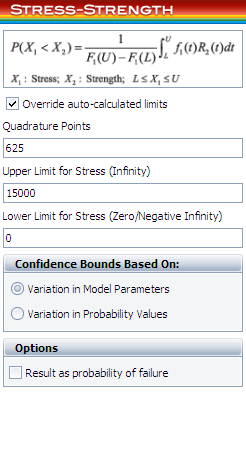
Since the warranty is 1 year/15,000 miles, all the vehicles with mileage larger than 15,000 should not be considered in the calculation. Therefore, the conditional stress distribution conditioning on the mileage less than 15,000 should be used. This is done by using the following settings in the tool:
The calculated results are:
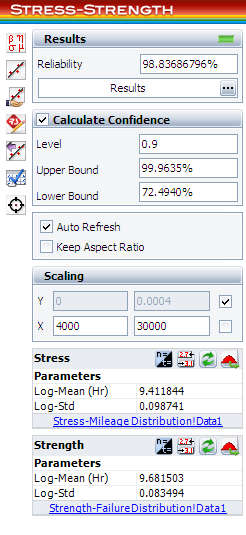
The estimated reliability for vehicles less than 15,000 miles per year is 98.84%. The associated confidence bounds are estimated from the variance of the distribution parameters. With larger samples for the stress and strength data, the width of the bounds will be narrower.