Monte Carlo Simulation Example
Monte Carlo Simulation A Hinge Length Example
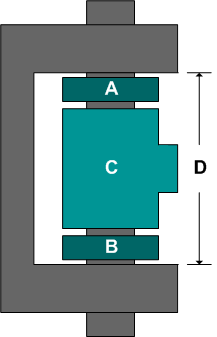
A hinge is made up of four components A, B, C, D. Seven units of each component were taken from the assembly line and the following measurements (in cm) were recorded:
- [math]\displaystyle{ \begin{matrix} \text{Dimensions for A} & \text{Dimensions for B} & \text{Dimensions for C} & \text{Dimensions for D} \\ \text{2}\text{.0187} & \text{1}\text{.9795} & \text{30}\text{.4216} & \text{33}\text{.6573} \\ \text{1}\text{.9996} & \text{2}\text{.0288} & \text{29}\text{.9818} & \text{34}\text{.5432} \\ \text{2}\text{.0167} & \text{1}\text{.9883} & \text{29}\text{.9724} & \text{34}\text{.6218} \\ \text{2}\text{.0329} & \text{2}\text{.0327} & \text{30}\text{.192} & \text{34}\text{.7538} \\ \text{2}\text{.0233} & \text{2}\text{.0119} & \text{29}\text{.9421} & \text{35}\text{.1508} \\ \text{2}\text{.0273} & \text{2}\text{.0354} & \text{30}\text{.1343} & \text{35}\text{.2666} \\ \text{1}\text{.984} & \text{1}\text{.9908} & \text{30}\text{.0423} & \text{35}\text{.7111} \\ \end{matrix} }[/math]
Determine the number of times (A+B+C) will be greater than D.
Solution
The parts dimensions measurements were entered into a Weibull++ standard folio as separate data sheets and were analyzed assuming normal distribution and RRX as the analysis method. The parameters are:
- [math]\displaystyle{ \begin{matrix} \text{A} & \text{B} & \text{C} & \text{D} \\ \hat{\mu }=2.0146 & \hat{\mu }=2.0096 & \hat{\mu }=30.0981 & \hat{\mu }=34.8149 \\ \hat{\sigma }=0.0181 & \hat{\sigma }=0.0249 & \hat{\sigma }=0.1762 & \hat{\sigma }=0.7121 \\ \end{matrix} }[/math]
Based on the above parameters, a Monte Carlo simulation can be performed to estimate the number of times (A+B+C) will be greater than D.
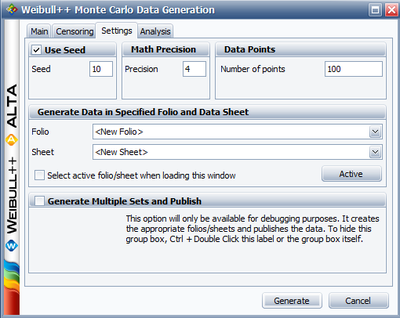
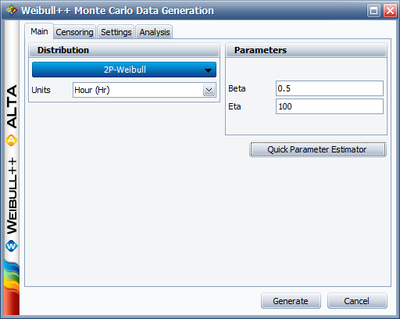
Select Generate Monte Carlo Data...from the Tools menu. Choose User Defined under Distribution and use the Insert Data Source... to use the A, B and C measurements data sheets to generate 100 data points that represent (A+B+C). The new created sheet is then renamed to Simulated A+B+C.
Following the same steps, use the D measurements data sheets to generate 100 data points that represent D. The new created sheet is then renamed to Simulated D.
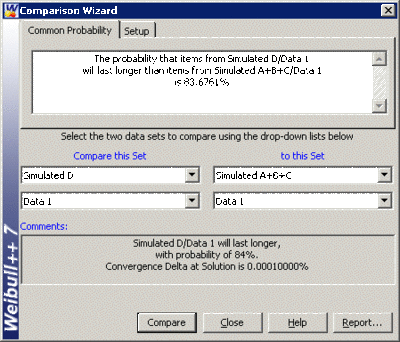
The two data sets that represent A+B+C and D are modeled with a normal distribution using RRX as the analysis method. Using the Test of Comparison tool, which is under Tools, the two data sets can be compared.
Therefore, the probability that (A+B+C) will be greater than D is [math]\displaystyle{ 100-83.67=16.23% }[/math] (note that the results could vary because of the randomness in the simulation.)


