Template:Example: Stress-Strength Analysis with Parameter Uncertainty
Stress-Strength Analysis with Parameter Uncertainty
Assume we are going to use stress-strength analysis to estimate the reliability of a component used in a vehicle. The stress is the usage milage distribution and the strength is the failure mile distribution of the component. The warranty is 1 year and 15,000 miles, which is earlier. The milage distribution per year is given the table below.
| Stress: Milage Distribution | ' |
| 10096 | 12405 |
| 10469 | 12527 |
| 10955 | 12536 |
| 11183 | 12595 |
| 11391 | 12657 |
| 11486 | 13777 |
| 11534 | 13862 |
| 11919 | 13971 |
| 12105 | 14032 |
| 12141 | 14138 |
The strength distribution or the failure mile distribution is given in the next table:
| Strength: Failure Distribution | ' |
| 13507 | 16125 |
| 13793 | 16320 |
| 13943 | 16327 |
| 14017 | 16349 |
| 14147 | 16406 |
| 14351 | 16501 |
| 14376 | 16611 |
| 14595 | 16625 |
| 14746 | 16670 |
| 14810 | 16749 |
| 14940 | 16793 |
| 14951 | 16862 |
| 15104 | 16930 |
| 15218 | 16948 |
| 15303 | 17024 |
| 15311 | 17041 |
| 15480 | 17263 |
| 15496 | 17347 |
| 15522 | 17430 |
| 15547 | 17805 |
| 15570 | 17884 |
| 15975 | 18549 |
| 16003 | 18575 |
| 16018 | 18813 |
| 16052 | 18944 |
Please estimate the reliability of the component within the warranty period (1 year/15,000 miles).
Solution
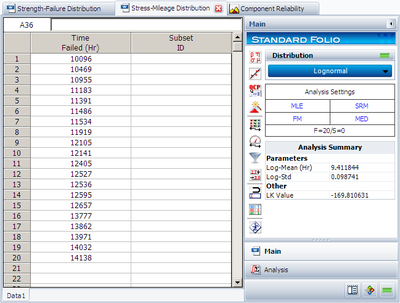
First, we need to estimate the stress and strength distribution using the above data. The estimated stress distribution is given in the figure below.

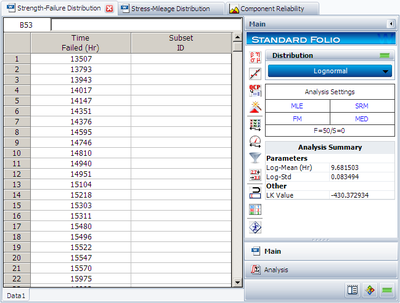
The estimated strength distribution is given as:

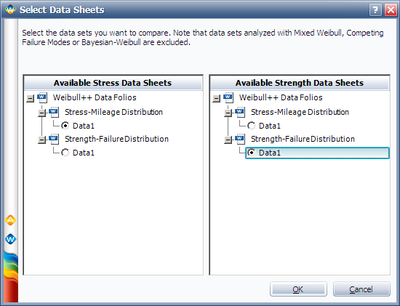
Add one Stress-Strength" Folio and choose the stress and strength distribution:

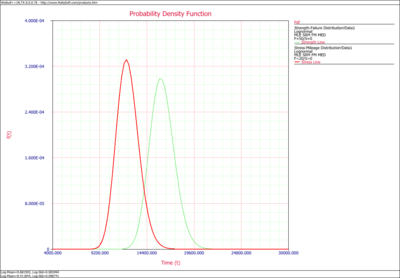
The stress-strength tool shows the pdf of the selected data folio. The pdf cuvers are given in the below figure:
