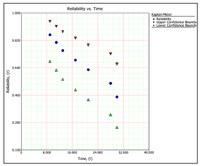
Weibull++ Non-Parametric RDA Plot
Jump to navigation
Jump to search
| Non-Parametric RDA |
| Weibull++ |
Reliability vs. TimeThe Reliability vs. Time plot shows the reliability values over time, capturing trends in the product’s failure behavior Example: |
| Weibull++ Plots |
http://www.reliawiki.com/index.php/Template:Parametric_RDA_plot

