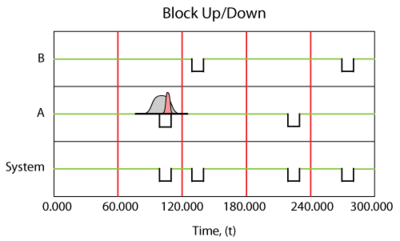
BlockSim Simulation RBD Plot ptSystemUpDown
|
Reliability Web Notes |
|---|
| Diagram Simulation System Up/Down |
| BlockSim |
|
Uptime, [math]\displaystyle{ {{T}_{UP}} }[/math] This is the average time the system was up and operating. This is obtained by taking the sum of the uptimes for each simulation and dividing it by the number of simulations. For this example, the uptime is 260.386. To compute the Operational Availability, [math]\displaystyle{ {{A}_{o}}, }[/math] for this system, then: [math]\displaystyle{ {{A}_{o}}=\frac{{{T}_{UP}}}{{{T}_{S}}} }[/math] CM Downtime, [math]\displaystyle{ {{T}_{C{{M}_{Down}}}} }[/math] This is the average time the system was down for corrective maintenance actions (CM) only. This is obtained by taking the sum of the CM downtimes for each simulation and dividing it by the number of simulations. For this example, this is 39.614. To compute the Inherent Availability, [math]\displaystyle{ {{A}_{I}}, }[/math] for this system over the observed time (which may or may not be steady state, depending on the length of the simulation), then: [math]\displaystyle{ {{A}_{I}}=\frac{{{T}_{S}}-{{T}_{C{{M}_{Down}}}}}{{{T}_{S}}} }[/math] Example: |
| System Uptime/Downtime |
