Template:Example: Weibull Distribution Interval Data Example
Jump to navigation
Jump to search
Weibull Distribution Interval Data Example
Suppose that we have run an experiment with eight units being tested and the following is a table of their last inspection times and times-to-failure:
| Data Point Index | Last Inspection | Time to Failure |
| 1 | 30 | 32 |
| 2 | 32 | 35 |
| 3 | 35 | 37 |
| 4 | 37 | 40 |
| 5 | 42 | 42 |
| 6 | 45 | 45 |
| 7 | 50 | 50 |
| 8 | 55 | 55 |
Analyze the data using several different parameter estimation techniques and compare the results.
Solution
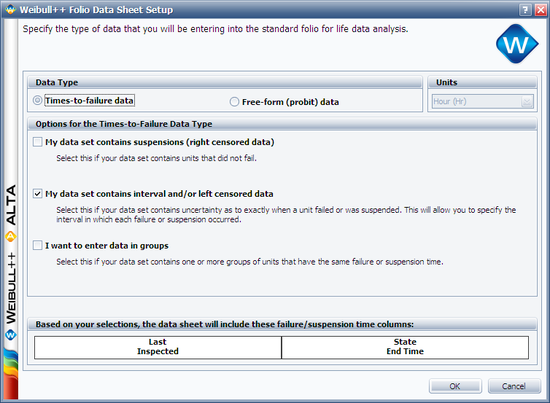
This data set can be entered into Weibull++ by opening a new Data Folio and choosing Times-to-failure and My data set contains interval and/or left censored data.
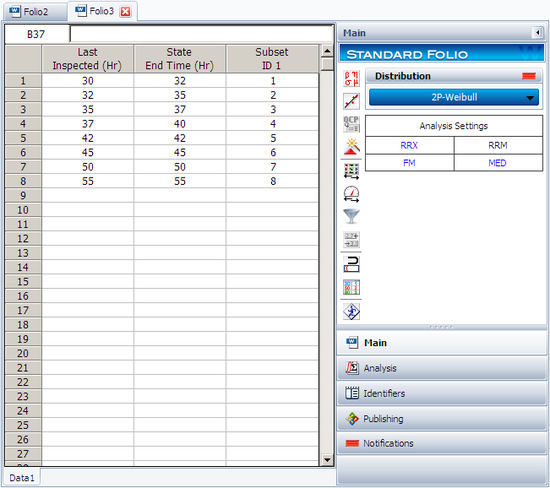
The data is entered as follows,
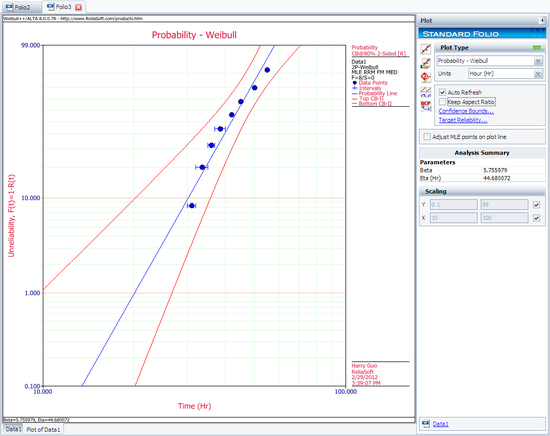
The computed parameters using maximum likelihood are:
- [math]\displaystyle{ \begin{align} & \hat{\beta }=5.76 \\ & \hat{\eta }=44.68 \\ \end{align} }[/math]
using RRX or rank regression on X:
- [math]\displaystyle{ \begin{align} & \hat{\beta }=5.70 \\ & \hat{\eta }=44.54 \\ \end{align} }[/math]
and using RRY or rank regression on Y:
- [math]\displaystyle{ \begin{align} & \hat{\beta }=5.41 \\ & \hat{\eta }=44.76 \\ \end{align} }[/math]
The plot of the MLE solution with the two-sided 90% confidence bounds is:


