Grouped Data Reference Example: Difference between revisions
Jump to navigation
Jump to search
No edit summary |
No edit summary |
||
| Line 9: | Line 9: | ||
{{Reference_Example_Heading2}} | {{Reference_Example_Heading2}} | ||
The following table shows the data. | |||
{| {{table}} | {| {{table}} | ||
| Line 29: | Line 31: | ||
{{Reference_Example_Heading3}} | {{Reference_Example_Heading3}} | ||
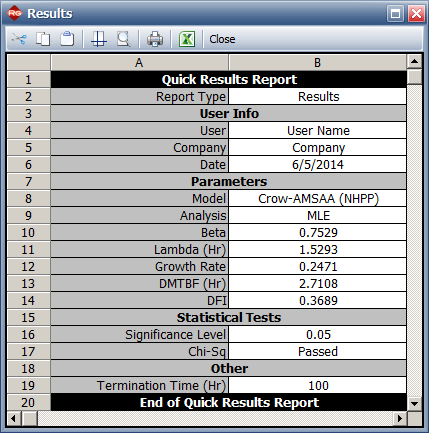
Beta = 0.753, Lambda = 1.53 | The book has the following results: | ||
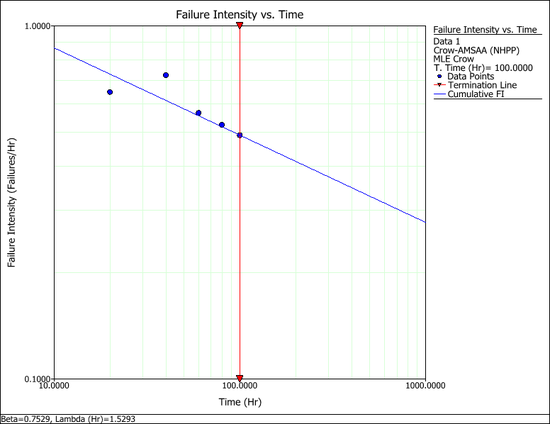
*Beta = 0.753, Lambda = 1.53 | |||
DMTBF = 2.6 hours | *DMTBF = 2.6 hours | ||
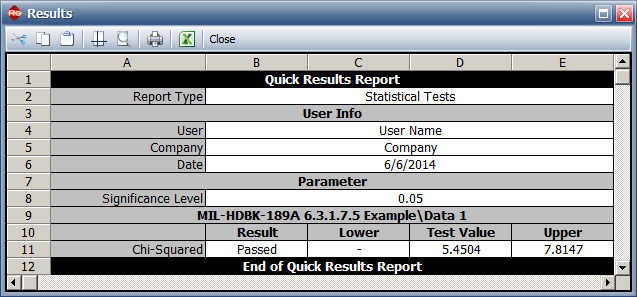
<math>\,\!X^{2}</math> = 5.5, critical value = 7.8 (Assume significance level = 0.1. Since <math>\,\!X^{2}</math> < critical value can fail to reject hypothesis that the Crow-AMSAA model fits the data). | *<math>\,\!X^{2}</math> = 5.5, critical value = 7.8 (Assume significance level = 0.1. Since <math>\,\!X^{2}</math> < critical value can fail to reject hypothesis that the Crow-AMSAA model fits the data). | ||
Revision as of 15:53, 13 June 2014
RGA_Reference_Examples_Banner.png


