Cumulative Damage Model for Step Stress Profiles: Difference between revisions
Jump to navigation
Jump to search
Kate Racaza (talk | contribs) No edit summary |
Kate Racaza (talk | contribs) No edit summary |
||
| Line 11: | Line 11: | ||
{{Reference_Example_Heading2}} | {{Reference_Example_Heading2}} | ||
A step-stress test is conducted for one type of cable insulation to estimate the insulation life at a constant design stress of 400 volts/mil. The test cables are of different thickness in unit of mils (0.001 inch). The stress is the applied step voltage divided by the thickness | A step-stress test is conducted for one type of cable insulation to estimate the insulation life at a constant design stress of 400 volts/mil. The test cables are of different thickness, in unit of mils (0.001 inch). The stress is the applied step voltage divided by the thickness. | ||
A total of 6 step-stress profiles are used. These stress profiles are calculated based on the applied voltage (Kilovolts) and the insulation thickness given on page 495 and Table 2.1. For all the stress profiles, the holding time for the first 4 steps is 10 mins. From step 5 onwards, a different a holding time is applied at each step for each of the stress profiles. These profiles are given in the following tables. | |||
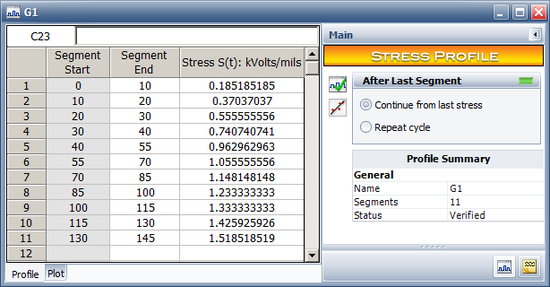
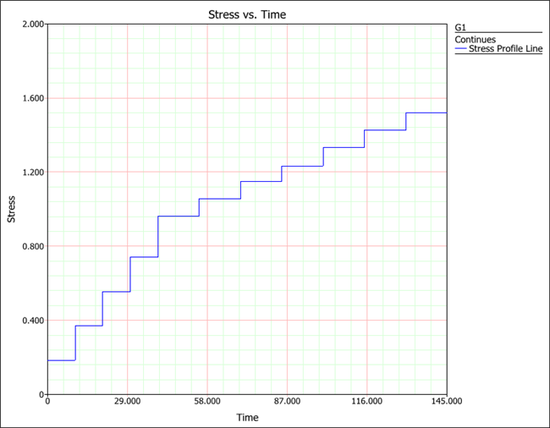
Profile 1 (named "G1"): | |||
Profile 1 (named "G1"): The holding time after step 4 is 15 mins and the thickness is 27 mils. | |||
{| {{table}} | {| {{table}} | ||
| Line 46: | Line 48: | ||
Profile 2 (named "G2"): | Profile 2 (named "G2"): The holding time after step 4 is 60 mins and the thickness is 29.5 mils. | ||
{| {{table}} | {| {{table}} | ||
| Line 77: | Line 79: | ||
|} | |} | ||
Profile 3 (named "G3"): | Profile 3 (named "G3"): The holding time after step 4 is 60 mins and the thickness is 28 mils. | ||
{| {{table}} | {| {{table}} | ||
| Line 108: | Line 110: | ||
|} | |} | ||
Profile 4 (named "G4"): | Profile 4 (named "G4"): The holding time after step 4 is 240 mins and the thickness is 29 mils. | ||
{| {{table}} | {| {{table}} | ||
| Line 139: | Line 141: | ||
|} | |} | ||
Profile 5 (named "G5"): | Profile 5 (named "G5"): The holding time after step 4 is 240 mins and the thickness is 30 mils. | ||
{| {{table}} | {| {{table}} | ||
| Line 170: | Line 172: | ||
|} | |} | ||
Profile 6 (named "G6"): | Profile 6 (named "G6"): The holding time after step 4 is 960 mins and the thickness is 30 mils. | ||
{| {{table}} | {| {{table}} | ||
| Line 255: | Line 257: | ||
{{Reference_Example_Heading3}} | {{Reference_Example_Heading3}} | ||
The power law life stress relationship and the Weibull distribution is used | The power law life stress relationship and the Weibull distribution is used to analyze the data. At a constant stress ''V'', the <math>\eta\,\!</math> is: | ||
::<math>\eta(V) = \left(\frac{V_{0}}{V} \right)^p\,\!</math> | ::<math>\eta(V) = \left(\frac{V_{0}}{V} \right)^p\,\!</math> | ||
| Line 271: | Line 273: | ||
The reliability function at time ''t'' | The reliability function at time ''t'' and stress ''V'' is: | ||
::<math>R(t,V) = e^{-\left(\frac{t}{\eta(V)} \right)^\beta}\,\!</math> | ::<math>R(t,V) = e^{-\left(\frac{t}{\eta(V)} \right)^\beta}\,\!</math> | ||
Revision as of 23:00, 11 June 2014
ALTA_Reference_Examples_Banner.png

