ACME Example: Difference between revisions
Jump to navigation
Jump to search
Chris Kahn (talk | contribs) |
No edit summary |
||
| Line 2: | Line 2: | ||
ACME manufacturing has implemented an accelerated testing program for their new design. A total of 40 units were tested at four different pressure levels. The operating stress level is 170 psi. | ACME manufacturing has implemented an accelerated testing program for their new design. A total of 40 units were tested at four different pressure levels. The operating stress level is 170 psi. | ||
{|border="1" align="center" style="border-collapse: collapse;" cellpadding="5" cellspacing="5" | |||
{| | |||
|- | |- | ||
!Stress Level, psi | !Stress Level, psi | ||
| Line 31: | Line 30: | ||
| ||544||288||228||140 | | ||544||288||228||140 | ||
|} | |} | ||
Do the following: | Do the following: | ||
1) Determine the parameters of the inverse power law Weibull model. | 1) Determine the parameters of the inverse power law Weibull model. | ||
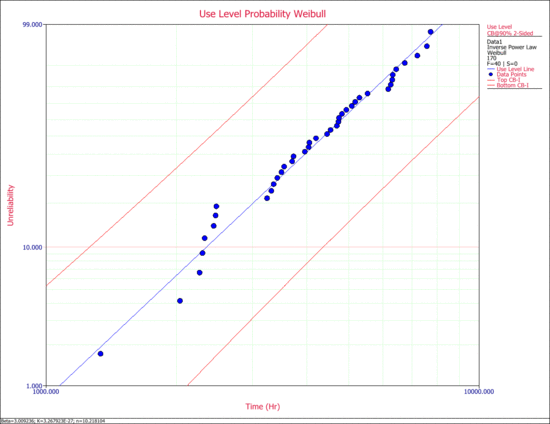
2) Obtain the use level probability plot with 90% 2-sided confidence bounds on time. | 2) Obtain the use level probability plot with 90% 2-sided confidence bounds on time. | ||
3) Obtain the Life vs. Stress plot with 90% 2-sided confidence bounds. | 3) Obtain the Life vs. Stress plot with 90% 2-sided confidence bounds. | ||
====Solution==== | ====Solution==== | ||
1) The parameters of the IPL-Weibull model are estimated to be: | 1) The parameters of the IPL-Weibull model are estimated to be: | ||
::<math>\begin{align} | ::<math>\begin{align} | ||
| Line 61: | Line 53: | ||
\end{align}</math> | \end{align}</math> | ||
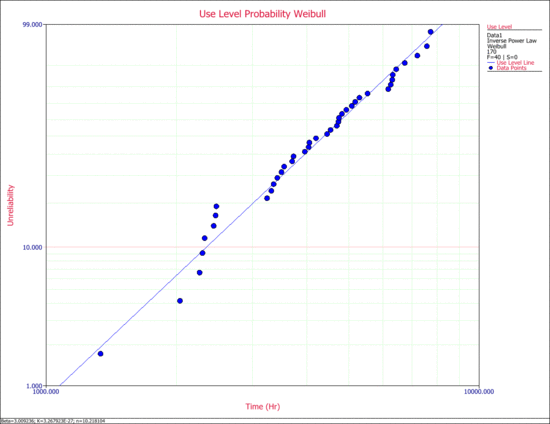
2) The use level probability plot is shown next. | |||
[[Image:new_7.gif|thumb|center|550px|The probability plot at a use stress level.]] | |||
The confidence bounds on time are the Type 1 bounds (Time Bounds) in ALTA. | The confidence bounds on time are the Type 1 bounds (Time Bounds) in ALTA. | ||
[[Image:new_9.gif|thumb|center|550px|The probability plot at a use stress level with 90% Type I confidence bounds.]] | |||
[[Image:new_9.gif|thumb|center| | |||
3) Similarly, the Life vs. Stress plot with the confidence bounds can be obtained. | 3) Similarly, the Life vs. Stress plot with the confidence bounds can be obtained. | ||
Revision as of 07:01, 9 August 2012
ACME Example
ACME manufacturing has implemented an accelerated testing program for their new design. A total of 40 units were tested at four different pressure levels. The operating stress level is 170 psi.
| Stress Level, psi | 220 psi | 230 psi | 240 psi | 250 psi |
|---|---|---|---|---|
| 165 | 93 | 72 | 26 | |
| 177 | 106 | 73 | 44 | |
| 238 | 156 | 99 | 63 | |
| 290 | 170 | 124 | 68 | |
| Times-to-failure, hr | 320 | 185 | 134 | 69 |
| 340 | 214 | 150 | 72 | |
| 341 | 220 | 182 | 77 | |
| 380 | 236 | 186 | 96 | |
| 449 | 252 | 190 | 131 | |
| 544 | 288 | 228 | 140 |
Do the following:
1) Determine the parameters of the inverse power law Weibull model.
2) Obtain the use level probability plot with 90% 2-sided confidence bounds on time.
3) Obtain the Life vs. Stress plot with 90% 2-sided confidence bounds.
Solution
1) The parameters of the IPL-Weibull model are estimated to be:
- [math]\displaystyle{ \begin{align} \beta =\ & 3.009236 \\ K=\ & 3.267923E-27 \\ n=\ & 10.218104 \end{align} }[/math]
2) The use level probability plot is shown next.
The confidence bounds on time are the Type 1 bounds (Time Bounds) in ALTA.
3) Similarly, the Life vs. Stress plot with the confidence bounds can be obtained.

