Circuit Boards Example: Difference between revisions
Jump to navigation
Jump to search
Chris Kahn (talk | contribs) |
No edit summary |
||
| Line 3: | Line 3: | ||
Twenty-seven circuit boards were tested with temperature as the accelerated stress (or stimuli). The goal was to estimate the reliability after 10 years at 100ºC. The circuit boards were tested and the following data obtained: | Twenty-seven circuit boards were tested with temperature as the accelerated stress (or stimuli). The goal was to estimate the reliability after 10 years at 100ºC. The circuit boards were tested and the following data obtained: | ||
{|border="1" align="center" style="border-collapse: collapse;" cellpadding="5" cellspacing="5" | |||
{| | |||
|- | |- | ||
! colspan="3" align="center"|Test Chamber Temperature 463K | ! colspan="3" align="center"|Test Chamber Temperature 463K | ||
| Line 37: | Line 36: | ||
|} | |} | ||
{| | {|border="1" align="center" style="border-collapse: collapse;" cellpadding="5" cellspacing="5" | ||
|- | |- | ||
! colspan="3" align="center"|Test Chamber Temperature 488K | ! colspan="3" align="center"|Test Chamber Temperature 488K | ||
| Line 65: | Line 64: | ||
|} | |} | ||
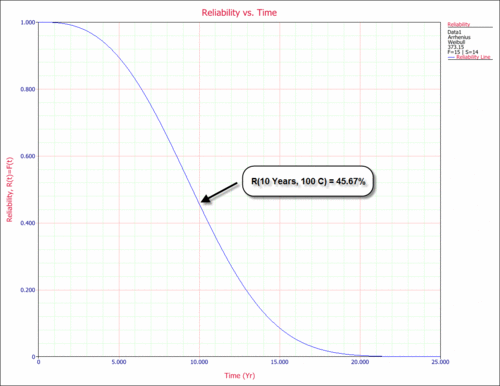
The data were entered in ALTA and analyzed utilizing an Arrhenius-Weibull model. Note that all units that did not fail in the test but failed for unrelated reasons were entered as suspensions. The reliability after 10 years at 100ºC is 45.67% as shown in the next figure. | |||
[[Image:pv_ex7_5.gif|thumb|center|500px|Reliability plot at use stress level]] | [[Image:pv_ex7_5.gif|thumb|center|500px|Reliability plot at use stress level]] | ||
Revision as of 06:51, 9 August 2012
Circuit Boards Example
Twenty-seven circuit boards were tested with temperature as the accelerated stress (or stimuli). The goal was to estimate the reliability after 10 years at 100ºC. The circuit boards were tested and the following data obtained:
| Test Chamber Temperature 463K | ||
|---|---|---|
| # of units | Time, hr | Observation |
| 1 | 2,403 | Failure |
| 1 | 2,668 | Unrelated Failure |
| 1 | 3,669 | Test Fixture Failure |
| 1 | 3,863 | Failure |
| 2 | 4,400 | Test Fixture Failure |
| 2 | 4,767 | Failure |
| 1 | 5,219 | Failure |
| 4 | 5,276 | Power Surge Failure |
| 2 | 7,517 | Failure |
| 1 | 7,840 | Failure |
| 2 | 8,025 | Failure |
| 1 | 8,571 | Removed - Test Terminated |
| Test Chamber Temperature 488K | ||
|---|---|---|
| # of units | Time, hr | Observation |
| 2 | 346 | Power Regulator Failure |
| 1 | 1,416 | Failure |
| 1 | 2,197 | Unrelated Failure |
| 1 | 2,533 | Failure |
| 1 | 2,630 | Failure |
| 1 | 2,701 | Test Fixture Failure |
| 1 | 3,000 | Failure |
| 1 | 3,489 | Failure |
| 1 | 6,720 | Removed - Test Terminated |
The data were entered in ALTA and analyzed utilizing an Arrhenius-Weibull model. Note that all units that did not fail in the test but failed for unrelated reasons were entered as suspensions. The reliability after 10 years at 100ºC is 45.67% as shown in the next figure.
