Template:ALTA Degradation Example: Difference between revisions
Chuck Smith (talk | contribs) |
|||
| Line 10: | Line 10: | ||
<br> | <br> | ||
<center><h3>Accelerated Degradation Data</h3></center> | <center><h3>Accelerated Degradation Data</h3></center> | ||
[[Image:ALTA13t1.png|center| | [[Image:ALTA13t1.png|center|250px|]] | ||
<br> | <br> | ||
| Line 20: | Line 20: | ||
<br> | <br> | ||
[[Image:a1b1b4.png|thumb|center| | [[Image:a1b1b4.png|thumb|center|200px|Sample degradation lines.]] | ||
<br> | <br> | ||
| Line 26: | Line 26: | ||
<br> | <br> | ||
[[Image:transfer2fol.png|thumb|center| | [[Image:transfer2fol.png|thumb|center|200px]] | ||
<br> | <br> | ||
| Line 32: | Line 32: | ||
<br> | <br> | ||
[[Image:t2fplot.png|thumb|center| | [[Image:t2fplot.png|thumb|center|200px|Use Level Weibull probability plot.]] | ||
<br> | <br> | ||
| Line 38: | Line 38: | ||
<br> | <br> | ||
[[Image:t2f-LvsS.png|thumb|center| | [[Image:t2f-LvsS.png|thumb|center|200px|Life vs. Stress plot.]] | ||
<br> | <br> | ||
| Line 44: | Line 44: | ||
<br> | <br> | ||
[[Image:t2d-qcp.png|thumb|center| | [[Image:t2d-qcp.png|thumb|center|200px|]] | ||
<br> | <br> | ||
Revision as of 23:40, 25 April 2012
Example
Consider a chemical solution (e.g. ink formulation, medicine, etc.) that degrades with time. A quantitative measure of the quality of the product can be obtained. This measure (QM) is said to be around 100 when the product is first manufactured and decreases with product age. The minimum acceptable value for QM is 50. Products with QM equal to or lower than 50 are considered to be out of compliance or failed.
Engineering analysis has indicated that at higher temperatures the QM has a higher rate of decrease. Assuming that the product's normal use temperature is 20º C (or 293K), the goal is to determine the shelf life of the product via an accelerated degradation test.
For the purpose of this analysis "shelf life" is defined as the time by which 10% of the products will have a QM that is out of compliance.
For this experiment, 15 samples of the product were tested, with 5 samples in each of three accelerated stress environments: 323K, 373K and 383K. Once a month, and for a period of seven months, the QM for each sample was measured and recorded. The data obtained is given in the next table.
Accelerated Degradation Data
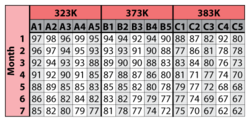
Since all of the readings are above the critical QM threshold of 50, none of the samples tested in this experiment had gone out of compliance (or failed) by the end of the test. However, there was sufficient data for the degradation of each sample to extrapolate a time-to-failure (i.e. the month at which we expect each sample to be at QM=50).
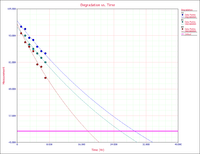
Using ALTA's Degradation Analysis Folio the data for all samples were entered and individually fitted to multiple exponential curves. The next figure shows sample graphs.
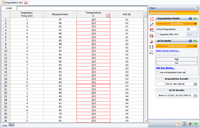
From each respective curve a time-to-failure (i.e. the time the product is expected to go out of compliance) was extrapolated and the data was analyzed using the Arrhenius-Weibull model as shown next.
Several plots can be obtained from the analysis. Specifically, the next figure shows a Weibull probability plot at the use stress level.
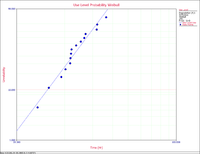
The next figure shows a Life vs. Stress plot where the line represents the time by which 10% of the units are expected to be out of compliance (at a given temperature).
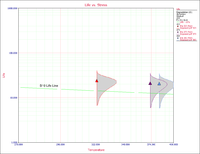
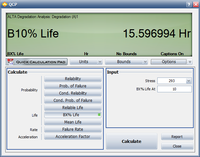
Based on this analysis, the projected shelf life of this product is 15.6 months. The desired result could also have been obtained from the QCP, as shown next.
