Template:Paper Clip Example: Difference between revisions
Nikki Helms (talk | contribs) |
Chuck Smith (talk | contribs) |
||
| Line 7: | Line 7: | ||
1) '''Open the Paper Clip.''' | 1) '''Open the Paper Clip.''' | ||
<br> | <br> | ||
[[Image:openclip.png|center| | [[Image:openclip.png|center|150px|]] | ||
<br> | <br> | ||
2) With one hand, hold the clip by the longer, outer loop. | 2) With one hand, hold the clip by the longer, outer loop. | ||
| Line 17: | Line 17: | ||
5) '''Close the Paper Clip.''' | 5) '''Close the Paper Clip.''' | ||
<br> | <br> | ||
[[Image:closeclip.png|center| | [[Image:closeclip.png|center|150px|]] | ||
<br> | <br> | ||
6) With one hand, continue to hold the clip by the longer, outer loop. | 6) With one hand, continue to hold the clip by the longer, outer loop. | ||
| Line 52: | Line 52: | ||
[[Image:degreesbend.png|thumb|center| | [[Image:degreesbend.png|thumb|center|200px|The accelerated test data analyzed in ALTA.]] | ||
<br> | <br> | ||
<br> | <br> | ||
[[Image:probweib.png|thumb|center| | [[Image:probweib.png|thumb|center|200px|Lognormal probabiliyt plot of both stress levels from ALTA.]] | ||
<br> | <br> | ||
<br> | <br> | ||
[[Image:accvsstress.png|thumb|center| | [[Image:accvsstress.png|thumb|center|200px|The resulting Acceleration Factor vs. Stress plot from ALTA.]] | ||
<br> | <br> | ||
| Line 64: | Line 64: | ||
<br> | <br> | ||
[[Image:Ch12-Ex1-4.png|thumb|center| | [[Image:Ch12-Ex1-4.png|thumb|center|200px|The Mean Life at 45 degrees bend.]] | ||
| Line 70: | Line 70: | ||
<br> | <br> | ||
[[Image:ALTA14.5b.gif|thumb|center| | [[Image:ALTA14.5b.gif|thumb|center|150px|The base <math>45^\circ </math> data analyzed in ReliaSoft's Weibull++, utilizing a lognormal distribution shown on lognormal probability paper.]] | ||
<br> | <br> | ||
[[Image:ALTA14.5.gif|thumb|center| | [[Image:ALTA14.5.gif|thumb|center|200px|Calculated Mean Life from base test.]] | ||
<br> | <br> | ||
Revision as of 23:28, 25 April 2012
Paper Clip Example
To illustrate the principles behind accelerated testing, consider the following simple example which involves a paper clip and can be easily and independently performed by the reader. The objective was to determine the mean number of cycles-to-failure of a given paper clip. The use cycles were assumed to be at a 45º bend. The acceleration stress was determined to be the angle to which we bend the clips, thus two accelerated bend stresses of 90º and 180º were used. The paper clips were tested using the following procedure for the 90º bend. A similar procedure was also used for the 180º and 45º test.
1) Open the Paper Clip.
2) With one hand, hold the clip by the longer, outer loop.
3) With the thumb and forefinger of the other hand, grasp the smaller, inner loop.
4) Pull the smaller, inner loop out and down 90 degrees so that a right angle is formed as shown.
5) Close the Paper Clip.
6) With one hand, continue to hold the clip by the longer, outer loop.
7) With the thumb and forefinger of the other hand, grasp the smaller, inner loop.
8) Push the smaller inner loop up and in 90 degrees so that the smaller loop is returned to the original upright position in line with the larger, outer loop as shown.
9) This completes one cycle.
10) Repeat until the paper clip breaks. Count and record the cycles-to-failure for each clip.
At this point, the reader must note that the paper clips used in this example were Jumbo paper clips capable of repeated bending. Different paper clips will yield different results. Additionally, and so that no other stresses are imposed, caution must be taken to assure that the rate at which the paper clips are cycled remains the same across the experiment.
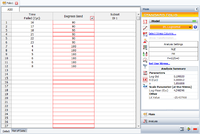
For the experiment, a sample of six paper clips was tested to failure at both 90º and 180º bends. A base test sample of six paper clips was tested at a 45º bend (the assumed use stress level) to confirm the analysis. The cycles-to-failure are given next.
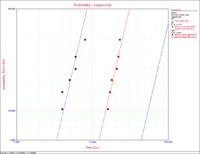
The accelerated test data set was then analyzed in ALTA, assuming a lognormal life distribution (fatigue) and an inverse power law relationship (non-thermal) for the life-stress model. The analysis and some of the results are shown in the next figures.
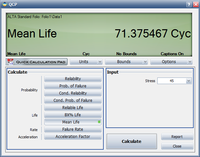
The MTTF at 45 degrees is found to be 71.375467 cycles as shown next.
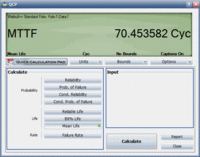
The next two figures show the analysis of the base data in Weibull++ and the base MTTF estimate. In this case, our accelerated test correctly predicted the MTTF as verified by our base test.


