Template:Example:Eyring: Difference between revisions
Jump to navigation
Jump to search
| Line 7: | Line 7: | ||
<br> | <br> | ||
<br> | <br> | ||
[[Image:6stresstimefailed. | [[Image:6stresstimefailed.png|center|400px|''Pdf'' of the lognormal distribution with different log-std values.]] | ||
<br> | <br> | ||
<br> | <br> | ||
Revision as of 17:32, 20 March 2012
Eyring-Weibull Example
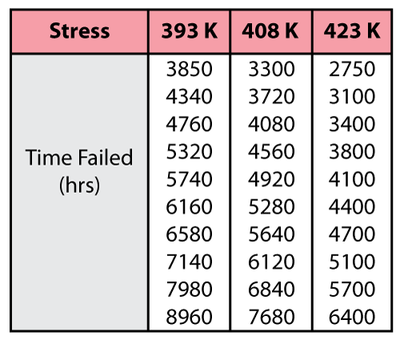
Consider the following times-to-failure data at three different stress levels.
The data set was analyzed jointly and with a complete MLE solution over the entire data set using ReliaSoft's ALTA yielding:
- [math]\displaystyle{ \widehat{\beta }=4.29186497 }[/math]
- [math]\displaystyle{ \widehat{A}=-11.08784624 }[/math]
- [math]\displaystyle{ \widehat{B}=1454.08635742 }[/math]
Once the parameters of the model are defined, other life measures can be directly obtained using the appropriate equations. For example, the MTTF can be obtained for the use stress level of 323K using:
- [math]\displaystyle{ \overline{T}=\frac{1}{V}{{e}^{-\left( A-\tfrac{B}{V} \right)}}\cdot \Gamma \left( \frac{1}{\beta }+1 \right) }[/math]
or:
- [math]\displaystyle{ \begin{align} & \overline{T}= & \frac{1}{323}{{e}^{-\left( -11.08784624-\tfrac{1454.08635742}{323} \right)}}\cdot \Gamma \left( \frac{1}{4.29186497}+1 \right) =16,610\text{ }hr \end{align} }[/math]
