Template:Example: Weibull Disribution Unreliability RRX Example: Difference between revisions
Created page with '==Weibull Distribution Example 8== What is the unreliability of the units in Example 1 for a mission duration of 30 hours, starting the mission at age zero? To replicate the res…' |
No edit summary |
||
| Line 1: | Line 1: | ||
''' Weibull Disribution Unreliability RRX Example''' | |||
What is the unreliability of the units | Assume that six identical units are being tested. All the six failur times are: 93, 34, 16, 120, 53 and 75. What is the unreliability of the units for a mission duration of 30 hours, starting the mission at age zero? To replicate the results in this reference with Weibull++, choose RRX (Rank Regression on X) as the calculation method. | ||
'''Solution''' | |||
First, use Weibull++ to obtain the parameters using RRX. | First, use Weibull++ to obtain the parameters using RRX. | ||
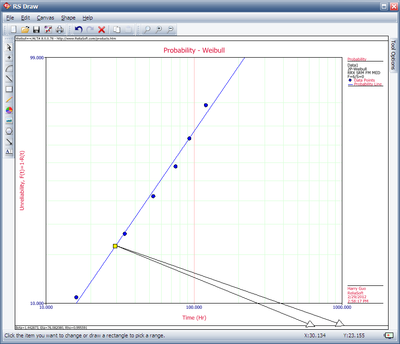
Then, we investigate several methods of solution for this problem. The first, and more laborious, method is to extract the information directly from the plot. You may do this with either the screen plot in RS Draw or the printed copy of the plot. (When extracting information from the screen plot in RS Draw, note that the translated axis position of your mouse is always shown on the bottom right corner.) | Then, we investigate several methods of solution for this problem. The first, and more laborious, method is to extract the information directly from the plot. You may do this with either the screen plot in RS Draw or the printed copy of the plot. (When extracting information from the screen plot in '''RS Draw''', note that the translated axis position of your mouse is always shown on the bottom right corner.) | ||
[[Image: RS Draw.png|thumb|center|400px]] | |||
Using this first method, enter either the screen plot or the printed plot with T = 30 hours, go up vertically to the straight line fitted to the data, then go horizontally to the ordinate, and read off . Then, a good estimate of the sought unreliability is 23%. (Also, the reliability estimate is 1.0 - 0.23 = 0.77 or 77%.) | Using this first method, enter either the screen plot or the printed plot with T = 30 hours, go up vertically to the straight line fitted to the data, then go horizontally to the ordinate, and read off . Then, a good estimate of the sought unreliability is 23%. (Also, the reliability estimate is 1.0 - 0.23 = 0.77 or 77%.) | ||
The second method involves the use of the Quick Calculation Pad (QCP). | The second method involves the use of the '''Quick Calculation Pad (QCP)''. | ||
[[Image: QCP icon.png|thumb|center|400px]] | |||
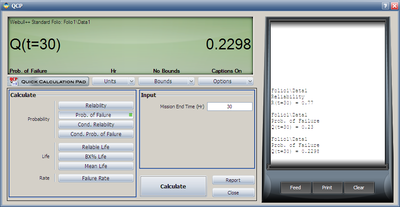
Once activated, the QCP will appear on your desktop. Select '''Prob. of Failure''' Calculations and enter 30 hours in the Mission End Time box. Click Calculate to get the result. | |||
[[Image: QCP Result.png|thumb|center|400px]] | |||
Note that the results in QCP vary according to the parameter estimation method used. The above results are obtained using RRX. | Note that the results in QCP vary according to the parameter estimation method used. The above results are obtained using RRX. | ||
Revision as of 22:15, 29 February 2012
Weibull Disribution Unreliability RRX Example
Assume that six identical units are being tested. All the six failur times are: 93, 34, 16, 120, 53 and 75. What is the unreliability of the units for a mission duration of 30 hours, starting the mission at age zero? To replicate the results in this reference with Weibull++, choose RRX (Rank Regression on X) as the calculation method.
Solution
First, use Weibull++ to obtain the parameters using RRX.
Then, we investigate several methods of solution for this problem. The first, and more laborious, method is to extract the information directly from the plot. You may do this with either the screen plot in RS Draw or the printed copy of the plot. (When extracting information from the screen plot in RS Draw, note that the translated axis position of your mouse is always shown on the bottom right corner.)

Using this first method, enter either the screen plot or the printed plot with T = 30 hours, go up vertically to the straight line fitted to the data, then go horizontally to the ordinate, and read off . Then, a good estimate of the sought unreliability is 23%. (Also, the reliability estimate is 1.0 - 0.23 = 0.77 or 77%.)
The second method involves the use of the 'Quick Calculation Pad (QCP).

Once activated, the QCP will appear on your desktop. Select Prob. of Failure Calculations and enter 30 hours in the Mission End Time box. Click Calculate to get the result.

Note that the results in QCP vary according to the parameter estimation method used. The above results are obtained using RRX.