Weibull++ Standard Folio Plot ptContour: Difference between revisions
Created page with '{{Template:NoSkin}} {| align="center" class="FCK__ShowTableBorders" border="0" cellspacing="1" cellpadding="1" |- ! scope="col" | {{Font|Reliability Web Notes|12|tahoma|bold|Blu…' |
No edit summary |
||
| Line 2: | Line 2: | ||
{| align="center" class="FCK__ShowTableBorders" border="0" cellspacing="1" cellpadding="1" | {| align="center" class="FCK__ShowTableBorders" border="0" cellspacing="1" cellpadding="1" | ||
|- | |- | ||
|- | |||
| align="center" valign="middle" | [[Image:weibullworld.gif|center]] | |||
! scope="col" | | ! scope="col" | | ||
{{Font|Reliability Web Notes|12|tahoma|bold|Blue}} | {{Font|Reliability Web Notes|12|tahoma|bold|Blue}} | ||
| Line 14: | Line 16: | ||
| align="center" valign="middle" | [http://www.reliawiki.com/index.php/Weibull%2B%2B_Plots Weibull++ Plots] | | align="center" valign="middle" | [http://www.reliawiki.com/index.php/Weibull%2B%2B_Plots Weibull++ Plots] | ||
|} | |} | ||
Revision as of 16:00, 27 January 2012
 |
Reliability Web Notes |
|---|---|
| Diagram Simulation Point Availability | |
| BlockSim | |
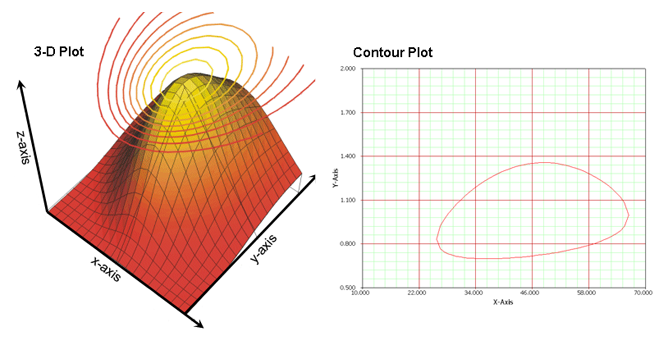
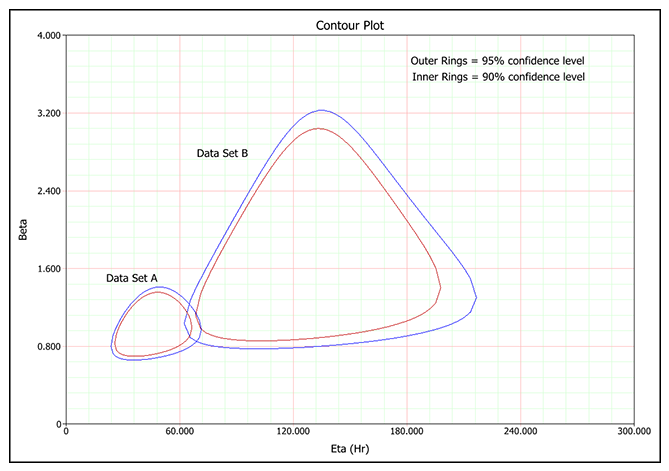
Contour PlotThe Contour Plot allows you to display a 3-D surface on a 2-D plot. The plot represents the 3-D surface by plotting constant z slices, called contours, on a 2-D format. Think of it as looking down at the 3-D plot from above and the lines connecting the (x,y) coordinates are plotted at the position where a given z value occurs.  In Weibull++, contour plots are typically used to compare data sets. You can use the overlay plot feature to superimpose two contour plots from two different data sets at the same confidence level in order to determine the level at which the two data sets are statistically different (to set up the plot, see Contour Plots). The data sets must be analyzed using the same distribution. In the example shown next, the two contour plots overlap at the 95% confidence level (outer rings). This means that the two data sets do not show a statistically significant difference at the 95% confidence level.  | |
| Weibull++ Plots |