Robust Design: Difference between revisions

From ReliaWiki
Jump to navigation Jump to search
No edit summary
No edit summary
Line 66: Line 66:


{{Reference_Example_Heading4|DOE++}}
Your text here.
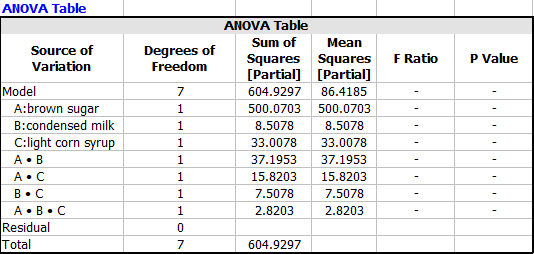
The software results match the book results. The ANOVA table is:
 
[[Image:robust_design_anova.png|center]]
 
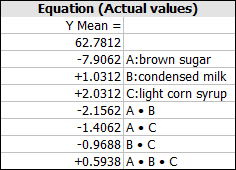
The final equation in terms of actual factors is:
 
[[Image:robust_design_equation.png|center]]

Revision as of 16:08, 14 July 2015

DOE Reference Examples Banner.png


New format available! This reference is now available in a new format that offers faster page load, improved display for calculations and images and more targeted search.

As of January 2024, this Reliawiki page will not continue to be updated. Please update all links and bookmarks to the latest references at DOE examples and DOE reference examples.


Robust Design

This example validates the robust design inner array with a two level factorial design and out array with a general full factorial design.

Reference Case

Data is from the example on page 1252 in the book Applied linear Statistical Models by Michael H.K, Christopher J.N, John N. William. Li, Fifth Edition, McGraw-Hill, 2005.

Data

Run A B C Noise Factor
60°F 70°F 80°F 90°F
1 1 1 1 48 49 56 63
2 1 -1 -1 50 52 55 63
3 -1 1 1 70 72 77 84
4 -1 -1 -1 42 65 70 73
5 -1 1 -1 61 70 78 79
6 -1 -1 1 65 74 74 77
7 1 -1 1 40 59 63 66
8 1 1 -1 48 51 55 60

.

Result From the book the results are:

Predictor Coef
Constant 62.781
A -7.906
B 1.031
C 2.031
AB -2.156
AC -1.406
BC -0.969
ABC 0.594


Results in DOE++

The software results match the book results. The ANOVA table is:

Robust design anova.png

The final equation in terms of actual factors is:

Robust design equation.png