Two Level Optimum Test Plan for One Stress: Difference between revisions
Jump to navigation
Jump to search
Kate Racaza (talk | contribs) No edit summary |
Kate Racaza (talk | contribs) No edit summary |
||
| Line 1: | Line 1: | ||
{{Reference Example|ALTA_Reference_Examples_Banner.png|ALTA_Reference_Examples}} | {{Reference Example|ALTA_Reference_Examples_Banner.png|ALTA_Reference_Examples}} | ||
This example compares the results for the 2 | This example compares the results for the 2 level statistically optimum test plan for one stress. | ||
| Line 11: | Line 11: | ||
{{Reference_Example_Heading2}} | {{Reference_Example_Heading2}} | ||
A Weibull distribution with an Arrhenius life stress relationship is used. The Arrhenius relationship uses the following formula: | A Weibull distribution with an Arrhenius life-stress relationship is used. The Arrhenius relationship uses the following formula: | ||
| Line 31: | Line 31: | ||
{{Reference_Example_Heading3}} | {{Reference_Example_Heading3}} | ||
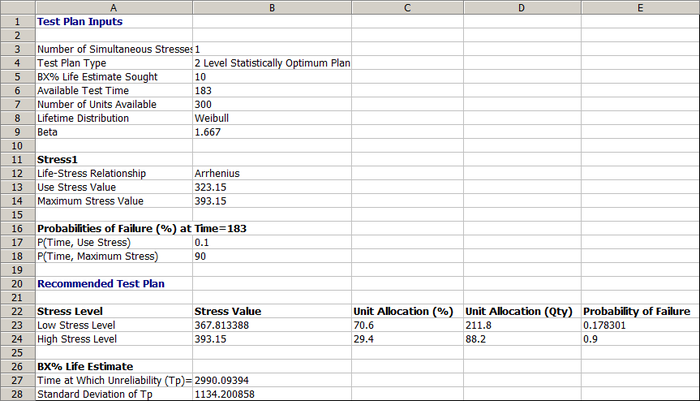
The | The 2 level statistically optimum test plan is: | ||
* 212 units should be tested at 95°C (368.15 °K) | * 212 units should be tested at 95°C (368.15 °K) | ||
* 88 units should be tested at 120°C (393.15 °K). | * 88 units should be tested at 120°C (393.15 °K). | ||
| Line 46: | Line 46: | ||
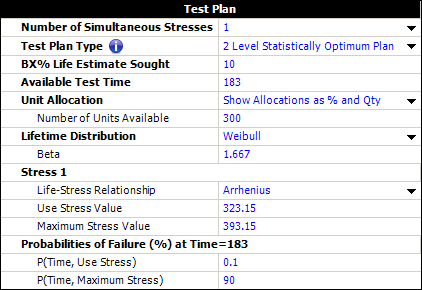
The resulting | The resulting test plan in ALTA is shown below. | ||
[[Image: Optimum plan one stress test plan.png|center|700 px]] | [[Image: Optimum plan one stress test plan.png|center|700 px]] | ||
Revision as of 15:20, 13 June 2014
ALTA_Reference_Examples_Banner.png

