Two Level Optimum Test Plan for One Stress: Difference between revisions
Jump to navigation
Jump to search
Kate Racaza (talk | contribs) No edit summary |
Kate Racaza (talk | contribs) No edit summary |
||
| Line 31: | Line 31: | ||
{{Reference_Example_Heading3}} | {{Reference_Example_Heading3}} | ||
The two level statistically optimum test plan is: | The two-level statistically optimum test plan is: | ||
* 212 units should be tested at 95°C (368.15 °K) | * 212 units should be tested at 95°C (368.15 °K) | ||
* 88 units should be tested at 120°C (393.15 °K). | * 88 units should be tested at 120°C (393.15 °K). | ||
| Line 46: | Line 46: | ||
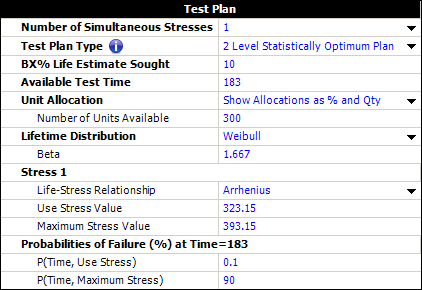
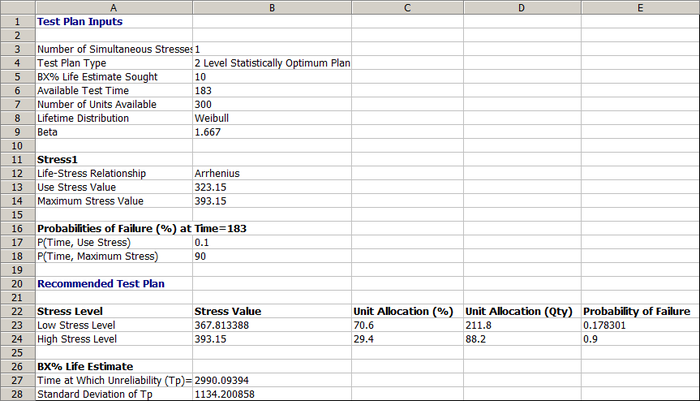
The resulting | The resulting two-level statistically optimum test plan in ALTA is shown below. | ||
[[Image: Optimum plan one stress test plan.png|center|700 px]] | [[Image: Optimum plan one stress test plan.png|center|700 px]] | ||
This test plan shows that: | |||
* The low stress level (row 23) should be 367.8°K (94.65°C) and about 212 units should be tested at this temperature. | * The low stress level (row 23 in the picture above) should be 367.8°K (94.65°C) and about 212 units should be tested at this temperature. | ||
* The high stress level | * The high stress level should be 393.15°K (120°C) and about 88 units should be tested at this temperature. | ||
The results above are the same as the results given in the book. | The results above are the same as the results given in the book. | ||
The estimated standard deviation of the log B10 life at 50°C can be calculate | The estimated standard deviation of the log B10 life at 50°C can be calculate from the values given in the '''BX% Life Estimate''' area (row 26) of the results shown above. | ||
::<math>Ase\left[log \left(\hat{t}_{0.1}(50) \right) \right] = \frac{Ase\hat{t}_{0.1}(50)}{\hat{t}_{0.1}(50)} = \frac{1134.2}{2990.09} = 0.37932\,\!</math> | ::<math>Ase\left[log \left(\hat{t}_{0.1}(50) \right) \right] = \frac{Ase\left(\hat{t}_{0.1}(50)\right)}{\hat{t}_{0.1}(50)} = \frac{1134.2}{2990.09} = 0.37932\,\!</math> | ||
This is very close to the estimated standard deviation in the book. The difference is | This is very close to the estimated standard deviation in the book. The difference is likely due to rounding error. | ||
Revision as of 15:56, 12 June 2014
ALTA_Reference_Examples_Banner.png

