|
|
| Line 1: |
Line 1: |
| {{Reference Example|ALTA_Reference_Examples_Banner.png|ALTA_Reference_Examples}} | | {{Reference Example|ALTA_Reference_Examples_Banner.png|ALTA_Reference_Examples}} |
| This example compares the results for the GLL relationship for Weibull distribution. | | This example compares the results for the GLL life-stress relationship with a Weibull distribution. |
|
| |
|
|
| |
|
| Line 10: |
Line 10: |
| {{Reference_Example_Heading2}} | | {{Reference_Example_Heading2}} |
|
| |
|
| The data is given below. | | The following table shows the data. |
| {| {{table}} | | {| {{table}} |
| !State F/S | | !State F/S |
Revision as of 15:24, 13 June 2014
ALTA_Reference_Examples_Banner.png
This example compares the results for the GLL life-stress relationship with a Weibull distribution.
Reference Case
The data set is from Example 7.14 on page 297 in book Life Cycle Reliability Engineering by Dr. Guangbin Yang, John Wiley & Sons, 2007.
Data
The following table shows the data.
| State F/S
|
Time to State (Hr)
|
Temperature (°C)
|
Group ID
|
| F |
1138 |
100 |
1
|
| F |
1944 |
100 |
1
|
| F |
2764 |
100 |
1
|
| F |
2846 |
100 |
1
|
| F |
3246 |
100 |
1
|
| F |
3803 |
100 |
1
|
| F |
5046 |
100 |
1
|
| F |
5139 |
100 |
1
|
| S |
5500 |
100 |
1
|
| S |
5500 |
100 |
1
|
| S |
5500 |
100 |
1
|
| S |
5500 |
100 |
1
|
| F |
1121 |
120 |
2
|
| F |
1572 |
120 |
2
|
| F |
2329 |
120 |
2
|
| F |
2573 |
120 |
2
|
| F |
2702 |
120 |
2
|
| F |
3702 |
120 |
2
|
| F |
4277 |
120 |
2
|
| S |
4500 |
120 |
2
|
| F |
420 |
150 |
3
|
| F |
650 |
150 |
3
|
| F |
703 |
150 |
3
|
| F |
838 |
150 |
3
|
| F |
1086 |
150 |
3
|
| F |
1125 |
150 |
3
|
| F |
1387 |
150 |
3
|
| F |
1673 |
150 |
3
|
| F |
1896 |
150 |
3
|
| F |
2037 |
150 |
3
|
Result
The model used in the book is:
- [math]\displaystyle{ \,\!ln\left ( \eta \right )=\alpha _{0}+\alpha _{1}\frac{1}{T} }[/math]
The book has the following results:
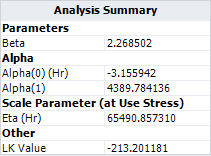
- The model parameters are: [math]\displaystyle{ \,\!\alpha _{0}=-3.156 }[/math] , [math]\displaystyle{ \,\!\alpha _{1}=4390 }[/math] and [math]\displaystyle{ \,\!\beta =2.27 }[/math].
- The variance of each parameter is: [math]\displaystyle{ \,\!Var\left ( \alpha _{0} \right )=3.08 }[/math] , [math]\displaystyle{ \,\!Var\left ( \alpha _{1} \right )=484819.5 }[/math] and [math]\displaystyle{ \,\!Var\left ( \beta\right )=0.1396 }[/math] .
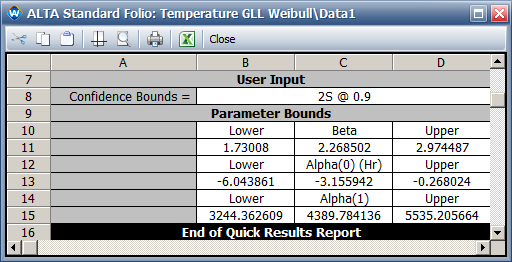
- The two-sided 90% confidence intervals for the model parameters are: [math]\displaystyle{ \,\!\left [ \alpha _{0,L},\alpha _{0,U} \right ]=\left [ -6.044, -0.269 \right ] }[/math] , [math]\displaystyle{ \,\!\left [ \alpha _{1,L},\alpha _{1,U} \right ]=\left [ 3244.8, 5535.3 \right ] }[/math] and [math]\displaystyle{ \,\!\left [ \beta _{1,L},\beta _{1,U} \right ]=\left [ 1.73, 2.97 \right ] }[/math] .
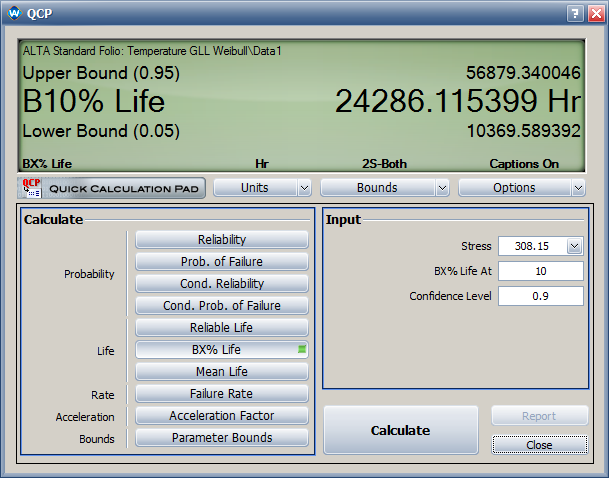
- The estimated B10 life at temperature of 35°C is 24,286 hours. The two-sided 90% confidence interval is [10371, 56867].
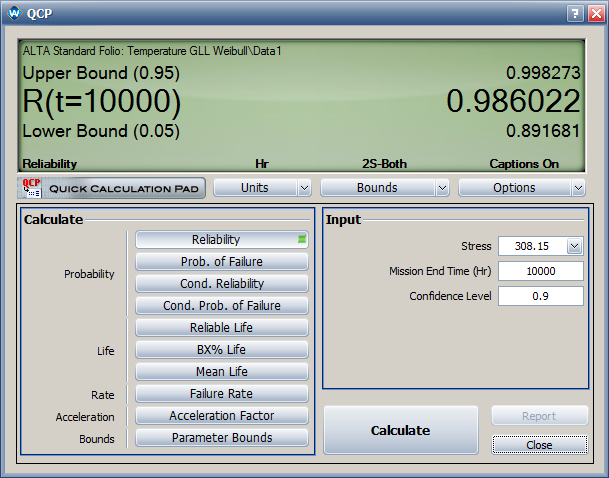
- The estimated reliability at 35°C and 10,000 hours is [math]\displaystyle{ \,\!R\left ( 10000 \right )=0.9860 }[/math] . The two-sided 90% confidence interval is [0.892, 0.998].
Results in ALTA
In ALTA, the GLL model with Weibull distribution is used. Since temperature is the stress, the reciprocal transform is used. The results are:
- The model parameters are:
- The variances of the parameters are:
- The two-sided 90% confidence intervals for the model parameters are:
- The estimated B10 life and its two-sided 90% confidence intervals are:
- The estimated reliability with its two-sided 90% confidence interval at 35°C and 10,000 hours are:


