|
|
| Line 150: |
Line 150: |
|
| |
|
| *ML estimations for the model parameters are: | | *ML estimations for the model parameters are: |
| | |
|
| |
|
| [[image:Arrhenius Lognormal_Analysis Summary.png|center]] | | [[image:Arrhenius Lognormal_Analysis Summary.png|center]] |
| | |
| | |
| | *The 95% confidence intervals are: |
|
| |
|
|
| |
|
| [[image:Arrhenius Lognormal_Parameter Bounds.png|center]] | | [[image:Arrhenius Lognormal_Parameter Bounds.png|center]] |
|
| |
|
| | |
| | The variance/covariance matrix for , , and is: |
|
| |
|
|
| |
|
| [[image:Arrhenius Lognormal_Var_Cov Results.png|center]] | | [[image:Arrhenius Lognormal_Var_Cov Results.png|center]] |
| | |
| | |
| | *The log-likelihood value is -321.7. |
| | |
| | |
| | It can be seen that all the results in ALTA are very close to the results in the book. |
Revision as of 21:41, 10 June 2014
ALTA_Reference_Examples_Banner.png
This example validates the calculation for the Arrhenius life stress relationship with a Lognormal distribution.
Reference Case
The data set is from Example 19.5 on page 498 in book Statistical Methods for Reliability Data by Dr. Meeker and Dr. Escobar, John Wiley & Sons, 1998.
Data
Device-A was tested under several different temperature settings.
| Number in Group
|
State F/S
|
Time to State
|
Temperature (°F)
|
Subset ID
|
| 30 |
S |
5000 |
283.15 |
1
|
| 1 |
F |
1298 |
313.15 |
2
|
| 1 |
F |
1390 |
313.15 |
2
|
| 1 |
F |
3187 |
313.15 |
2
|
| 1 |
F |
3241 |
313.15 |
2
|
| 1 |
F |
3261 |
313.15 |
2
|
| 1 |
F |
3313 |
313.15 |
2
|
| 1 |
F |
4501 |
313.15 |
2
|
| 1 |
F |
4568 |
313.15 |
2
|
| 1 |
F |
4841 |
313.15 |
2
|
| 1 |
F |
4982 |
313.15 |
2
|
| 90 |
S |
5000 |
313.15 |
2
|
| 1 |
F |
581 |
333.15 |
3
|
| 1 |
F |
925 |
333.15 |
3
|
| 1 |
F |
1432 |
333.15 |
3
|
| 1 |
F |
1586 |
333.15 |
3
|
| 1 |
F |
2452 |
333.15 |
3
|
| 1 |
F |
2734 |
333.15 |
3
|
| 1 |
F |
2772 |
333.15 |
3
|
| 1 |
F |
4106 |
333.15 |
3
|
| 1 |
F |
4674 |
333.15 |
3
|
| 11 |
S |
5000 |
333.15 |
3
|
| 1 |
F |
283 |
353.15 |
4
|
| 1 |
F |
361 |
353.15 |
4
|
| 1 |
F |
515 |
353.15 |
4
|
| 1 |
F |
638 |
353.15 |
4
|
| 1 |
F |
854 |
353.15 |
4
|
| 1 |
F |
1024 |
353.15 |
4
|
| 1 |
F |
1030 |
353.15 |
4
|
| 1 |
F |
1045 |
353.15 |
4
|
| 1 |
F |
1767 |
353.15 |
4
|
| 1 |
F |
1777 |
353.15 |
4
|
| 1 |
F |
1856 |
353.15 |
4
|
| 1 |
F |
1951 |
353.15 |
4
|
| 1 |
F |
1964 |
353.15 |
4
|
| 1 |
F |
2884 |
353.15 |
4
|
| 1 |
S |
5000 |
353.15 |
4
|
Result
The following function is used for the Ln-Mean [math]\displaystyle{ \,\!\mu {}' }[/math]:
- [math]\displaystyle{ \,\!\mu {}'=\beta _{0}+\beta _{1}\times \frac{11605}{T} }[/math]
where T is the temperature; [math]\displaystyle{ \,\!\beta _{1} }[/math] is the activation energy; [math]\displaystyle{ \,\!11605 }[/math] is from reciprocal of the Boltzmann constant . This function can be written in the following way:
- [math]\displaystyle{ \,\!e^{{\mu }'}=e^{\alpha _{0}+\frac{\alpha _{1}}{T}} }[/math]
The above equation is the general log-linear model in ALTA. In ALTA, the coefficients are denoted by [math]\displaystyle{ \,\!\alpha _{i} }[/math].
In fact, the above model also can be expressed using the traditional Arrhenius model:
- [math]\displaystyle{ \,\!e^{{\mu }'}=e^{\alpha _{0}+\frac{\alpha _{1}}{T}}=C\times e^{\frac{B}{T}} }[/math]
In the book, the following results are provided:
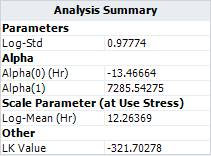
- ML estimations for the model parameters are: [math]\displaystyle{ \,\!\sigma =0.98 }[/math] , [math]\displaystyle{ \,\!\beta _{0}=-13.469 }[/math] , [math]\displaystyle{ \,\!\beta _{1}=0.6279 }[/math] (or [math]\displaystyle{ \,\!\alpha _{1}=7286.78 }[/math]).
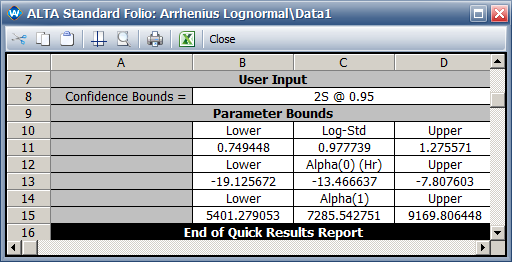
- The 95% confidence interval for [math]\displaystyle{ \,\!\sigma }[/math] is [0.75, 1.28], for [math]\displaystyle{ \,\!\beta _{0} }[/math] is [-19.1, -7.8] and for [math]\displaystyle{ \,\!\beta _{1} }[/math] is [0.47, 0.79].
- The variance/covariance matrix for [math]\displaystyle{ \,\!\sigma }[/math] , [math]\displaystyle{ \,\!\beta _{0} }[/math] and [math]\displaystyle{ \,\!\beta _{1} }[/math] is:
- [math]\displaystyle{ \,\!\begin{bmatrix}
0.0176 & -0.195 & 0.0059\\
-0.195 & 8.336 & -0.239\\
0.0059 & -0.239 & 0.0069
\end{bmatrix} }[/math]
- In terms of [math]\displaystyle{ \,\!\sigma }[/math] , [math]\displaystyle{ \,\!\alpha _{0} }[/math] and [math]\displaystyle{ \,\!\alpha _{1} }[/math], the variance/covariance matrix is:
- [math]\displaystyle{ \,\!\begin{bmatrix}
0.0176 & -0.195 & 68.4695\\
-0.195 & 8.336 & -2773.5950\\
68.4695 & -2773.5950 & 929264.5725
\end{bmatrix} }[/math]
Results in ALTA
- ML estimations for the model parameters are:
- The 95% confidence intervals are:
The variance/covariance matrix for , , and is:
- The log-likelihood value is -321.7.
It can be seen that all the results in ALTA are very close to the results in the book.


