|
|
| Line 18: |
Line 18: |
|
| |
|
| [[Image:Parameter estimator.jpg|center]] | | [[Image:Parameter estimator.jpg|center]] |
|
| |
| ==Risk Analysis and Probabilistic Design with Monte Carlo Simulation==
| |
| Monte Carlo simulation can be used to perform simple relationship-based simulations. The new `User Defined' distribution feature allows you to specify an equation relating different random variables. You can then determine the joint <math>pdf</math> for the simulated data set. This type of simulation has many applications in probabilistic design, risk analysis, quality control, etc. More advanced analysis, involving complex relationships, can be performed with advanced software specifically designed for stochastic event simulation such as ReliaSoft's RENO (see http://www.reliasoft.com/RENO).
| |
| ==== Example 16====
| |
| A hinge is made up of four components A, B, C, D. Seven units of each component were taken from the assembly line and the following measurements (in cm) were recorded:
| |
|
| |
|
| |
| <math>\begin{matrix}
| |
| \text{Dimensions for A} & \text{Dimensions for B} & \text{Dimensions for C} & \text{Dimensions for D} \\
| |
| \text{2}\text{.0187} & \text{1}\text{.9795} & \text{30}\text{.4216} & \text{33}\text{.6573} \\
| |
| \text{1}\text{.9996} & \text{2}\text{.0288} & \text{29}\text{.9818} & \text{34}\text{.5432} \\
| |
| \text{2}\text{.0167} & \text{1}\text{.9883} & \text{29}\text{.9724} & \text{34}\text{.6218} \\
| |
| \text{2}\text{.0329} & \text{2}\text{.0327} & \text{30}\text{.192} & \text{34}\text{.7538} \\
| |
| \text{2}\text{.0233} & \text{2}\text{.0119} & \text{29}\text{.9421} & \text{35}\text{.1508} \\
| |
| \text{2}\text{.0273} & \text{2}\text{.0354} & \text{30}\text{.1343} & \text{35}\text{.2666} \\
| |
| \text{1}\text{.984} & \text{1}\text{.9908} & \text{30}\text{.0423} & \text{35}\text{.7111} \\
| |
| \end{matrix}</math>
| |
|
| |
|
| |
|
| |
|
| |
| <math></math>
| |
|
| |
|
| |
|
| |
|
| |
| Determine the number of times (A+B+C) will be greater than D.
| |
| ==== Solution to Example 17====
| |
| The parts dimensions measurements were entered into a Weibull++ standard folio as separate data sheets and were analyzed assuming normal distribution and RRX as the analysis method. The parameters are:
| |
|
| |
|
| |
| <math>\begin{matrix}
| |
| \text{A} & \text{B} & \text{C} & \text{D} \\
| |
| \hat{\mu }=2.0146 & \hat{\mu }=2.0096 & \hat{\mu }=30.0981 & \hat{\mu }=34.8149 \\
| |
| \hat{\sigma }=0.0181 & \hat{\sigma }=0.0249 & \hat{\sigma }=0.1762 & \hat{\sigma }=0.7121 \\
| |
| \end{matrix}</math>
| |
|
| |
|
| |
| Based on the above parameters, a Monte Carlo simulation can be performed to estimate the number of times (A+B+C) will be greater than D.
| |
|
| |
| Select Generate Monte Carlo Data...from the Tools menu. Choose User Defined under Distribution and use the Insert Data Source... to use the A, B and C measurements data sheets to generate 100 data points that represent (A+B+C). The new created sheet is then renamed to Simulated A+B+C.
| |
|
| |
|
| |
| <math></math>
| |
|
| |
|
| |
| Following the same steps, use the D measurements data sheets to generate 100 data points that represent D. The new created sheet is then renamed to Simulated D.
| |
|
| |
|
| |
| <math></math>
| |
|
| |
|
| |
| The two data sets that represent A+B+C and D are modeled with a normal distribution using RRX as the analysis method. Using the Test of Comparison tool, which is under Tools, the two data sets can be compared.
| |
|
| |
|
| |
| <math></math>
| |
|
| |
|
| |
| Therefore, the probability that (A+B+C) will be greater than D is <math>100-83.67=16.23%</math> (note that the results could vary because of the randomness in the simulation.)
| |
New format available! This reference is now available in a new format that offers faster page load, improved display for calculations and images, more targeted search and the latest content available as a PDF. As of September 2023, this Reliawiki page will not continue to be updated. Please update all links and bookmarks to the latest reference at help.reliasoft.com/reference/life_data_analysis
|
Chapter 25: Stress-Strength Analysis
|
Using the same idea as illustrated in the previous section, one could determine the probability of failure based on the probability of stress exceeding strength. In this case, Eqn. (eqnStress) could be recast as:
[math]\displaystyle{ P\left[ Stress\ge Strength \right]=\mathop{}_{0}^{\infty }{{f}_{Strength}}(x)\cdot {{R}_{Stress}}(x)\cdot dx }[/math]
In this case, the data for the strength set would be actual data that is indicative of the strength of the material (i.e. maximum applied stress to cause failure), and the stress data would be actual stress data of the material under use conditions. Weibull++'s Stress-Strength Wizard allows you to perform such calculations.
The Stress-Strength Calculator is accessible from the Tools folder of the Project Explorer. The tool first asks for the locations of the stress and strength data from among the folios available, as shown below.
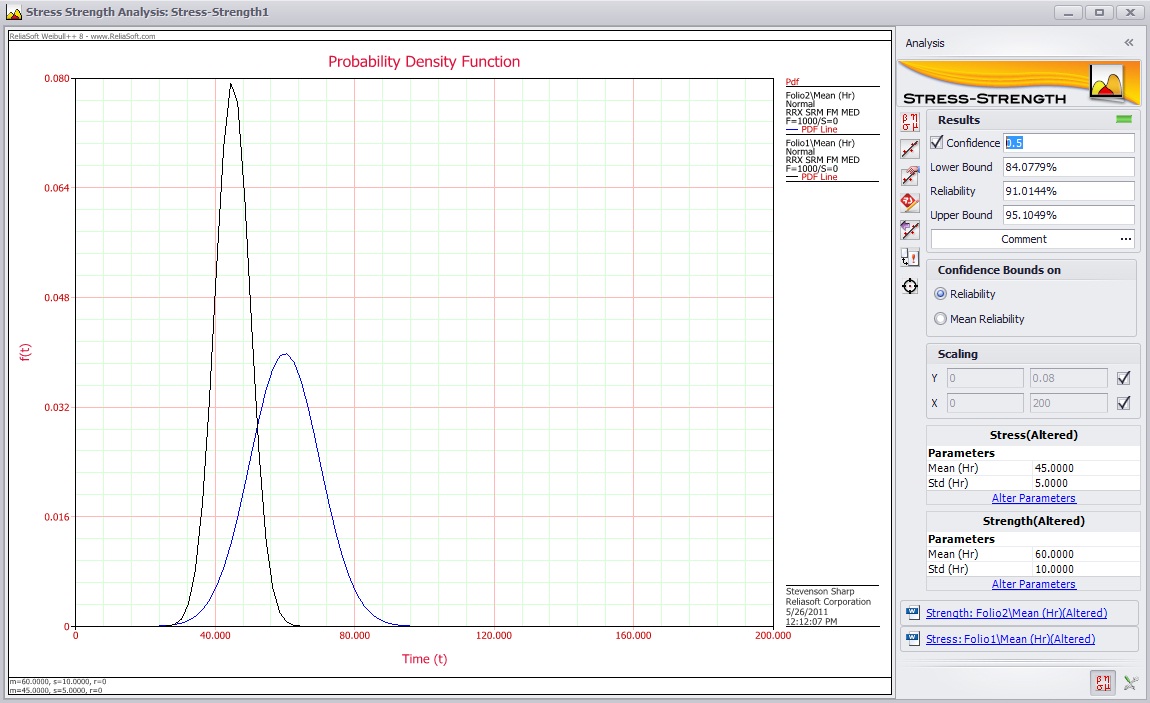
Once the tool knows where to find data for stress and strength, it automatically calculates the reliability and graphs the distributions of the stress and strength data, as shown below.
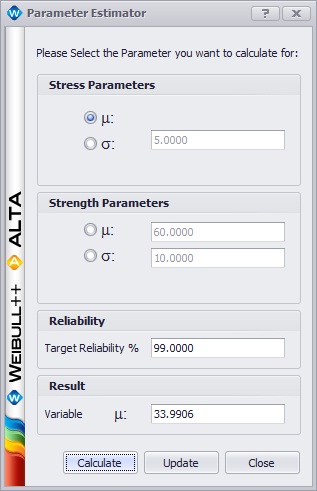
Once the reliability has been calculated, the user has two different options for performing sensitivity analysis (seeing how the system performance changes with changes in parameter values). The user can manually alter the distribution parameters used to calculate the reliability by clicking the “Alter Parameters” link for the appropriate distribution, or the user can use the Parameter Estimator to find what parameters result in a specified target reliability. The “Alter Parameters” link allows the user to manually set what she would like the distribution parameter(s) to be. Alternatively, the Parameter Estimator utility allows the user to select a target reliability to reach and a distribution parameter to adjust. The utility then adjusts the parameter value until the specified target is reached and outputs the parameter value that does so, as shown below.


