Circuit Boards Example: Difference between revisions
Kate Racaza (talk | contribs) m moved Template:Circuit Boards Example to Circuit Boards Example: incorrect namespace |
Kate Racaza (talk | contribs) No edit summary |
||
| Line 1: | Line 1: | ||
<noinclude>{{Banner ALTA Examples}}</noinclude> | |||
Twenty-seven circuit boards were put in an accelerated life test, with temperature as the stress (or stimuli). The goal is to estimate the reliability of the circuit boards after 10 years when operating at 100ºC. The following data were obtained: | |||
{|border="1" align="center" style="border-collapse: collapse;" cellpadding="5" cellspacing="5" | {|border="1" align="center" style="border-collapse: collapse;" cellpadding="5" cellspacing="5" | ||
| Line 64: | Line 65: | ||
|} | |} | ||
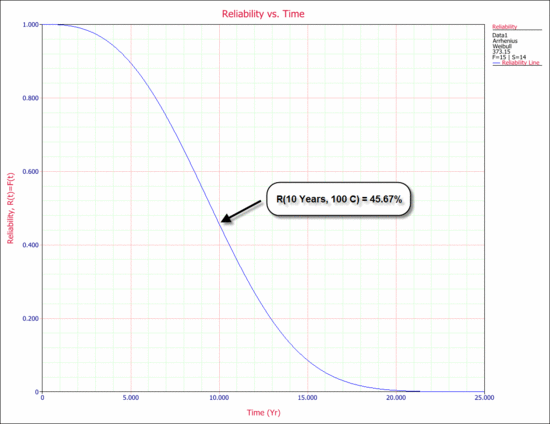
[[Image:pv_ex7_5.gif | The data were entered in the ALTA standard folio and analyzed with the Arrhenius-Weibull relationship model. Note that all units that did not fail in the test, but failed for unrelated reasons, were entered as suspensions. The reliability after 10 years at 100ºC is estimated to be 45.67%, as shown in the following reliability plot. This reliability value can also be obtained via the Quick Calculation Pad (QCP). | ||
[[Image:pv_ex7_5.gif|center|550px|Reliability plot at use stress level]] | |||
Revision as of 01:12, 15 August 2012
 |
New format available! This reference is now available in a new format that offers faster page load, improved display for calculations and images and more targeted search.
As of January 2024, this Reliawiki page will not continue to be updated. Please update all links and bookmarks to the latest references at ALTA examples and ALTA reference examples.
Twenty-seven circuit boards were put in an accelerated life test, with temperature as the stress (or stimuli). The goal is to estimate the reliability of the circuit boards after 10 years when operating at 100ºC. The following data were obtained:
| Test Chamber Temperature 463K | ||
|---|---|---|
| # of units | Time, hr | Observation |
| 1 | 2,403 | Failure |
| 1 | 2,668 | Unrelated Failure |
| 1 | 3,669 | Test Fixture Failure |
| 1 | 3,863 | Failure |
| 2 | 4,400 | Test Fixture Failure |
| 2 | 4,767 | Failure |
| 1 | 5,219 | Failure |
| 4 | 5,276 | Power Surge Failure |
| 2 | 7,517 | Failure |
| 1 | 7,840 | Failure |
| 2 | 8,025 | Failure |
| 1 | 8,571 | Removed - Test Terminated |
| Test Chamber Temperature 488K | ||
|---|---|---|
| # of units | Time, hr | Observation |
| 2 | 346 | Power Regulator Failure |
| 1 | 1,416 | Failure |
| 1 | 2,197 | Unrelated Failure |
| 1 | 2,533 | Failure |
| 1 | 2,630 | Failure |
| 1 | 2,701 | Test Fixture Failure |
| 1 | 3,000 | Failure |
| 1 | 3,489 | Failure |
| 1 | 6,720 | Removed - Test Terminated |
The data were entered in the ALTA standard folio and analyzed with the Arrhenius-Weibull relationship model. Note that all units that did not fail in the test, but failed for unrelated reasons, were entered as suspensions. The reliability after 10 years at 100ºC is estimated to be 45.67%, as shown in the following reliability plot. This reliability value can also be obtained via the Quick Calculation Pad (QCP).
