Life Data Classification: Difference between revisions
Kate Racaza (talk | contribs) No edit summary |
Kate Racaza (talk | contribs) No edit summary |
||
| Line 1: | Line 1: | ||
{{template:LDABOOK|5|Life Data Classifications}} | <noinclude>{{template:LDABOOK|5|Life Data Classifications}} | ||
''This article appears in the [[Accelerated_Life_Testing_and_ALTA|Accelerated Life Testing Data Analysis Reference book]]''</noinclude> | |||
Statistical models rely extensively on data to make predictions. In our case, the models are the ''statistical distributions'' and the data are the '' life data'' or '' times-to-failure data'' of our product. The accuracy of any prediction is directly proportional to the quality, accuracy and completeness of the supplied data. Good data, along with the appropriate model choice, usually results in good predictions. Bad, or insufficient data, will almost always result in bad predictions. | Statistical models rely extensively on data to make predictions. In our case, the models are the ''statistical distributions'' and the data are the '' life data'' or '' times-to-failure data'' of our product. The accuracy of any prediction is directly proportional to the quality, accuracy and completeness of the supplied data. Good data, along with the appropriate model choice, usually results in good predictions. Bad, or insufficient data, will almost always result in bad predictions. | ||
| Line 5: | Line 7: | ||
In the analysis of life data, we want to use all available data sets, which sometimes are incomplete or include uncertainty as to when a failure occurred. Life data can therefore be separated into two types: ''complete data'' (all information is available) or ''censored data'' (some of the information is missing). Each type is explained next. | In the analysis of life data, we want to use all available data sets, which sometimes are incomplete or include uncertainty as to when a failure occurred. Life data can therefore be separated into two types: ''complete data'' (all information is available) or ''censored data'' (some of the information is missing). Each type is explained next. | ||
====Complete Data==== | |||
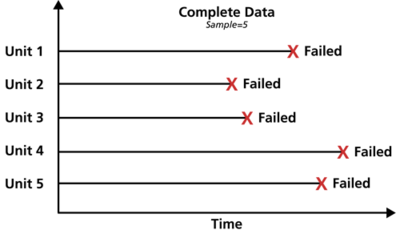
Complete data means that the value of each sample unit is observed or known. For example, if we had to compute the average test score for a sample of ten students, complete data would consist of the known score for each student. Likewise in the case of life data analysis, our data set (if complete) would be composed of the times-to-failure of all units in our sample. For example, if we tested five units and they all failed (and their times-to-failure were recorded), we would then have complete information as to the time of each failure in the sample. | |||
[[Image:complete data.png|center|400px|]] | |||
====Censored Data ==== | ====Censored Data ==== | ||
In many cases, all of the units in the sample may not have failed (i.e., the event of interest was not observed) or the exact times-to-failure of all the units are not known. This type of data is commonly called ''censored data''. There are three types of possible censoring schemes, right censored (also called suspended data), interval censored and left censored. | In many cases, all of the units in the sample may not have failed (i.e., the event of interest was not observed) or the exact times-to-failure of all the units are not known. This type of data is commonly called ''censored data''. There are three types of possible censoring schemes, right censored (also called suspended data), interval censored and left censored. | ||
=====Right Censored (Suspended) Data===== | |||
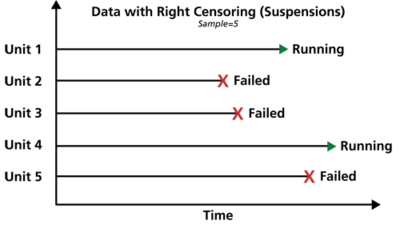
The most common case of censoring is what is referred to as ''right censored data'', or ''suspended data''. In the case of life data, these data sets are composed of units that did not fail. For example, if we tested five units and only three had failed by the end of the test, we would have right censored data (or suspended data) for the two units that did not failed. The term ''right censored'' implies that the event of interest (i.e., the time-to-failure) is to the right of our data point. In other words, if the units were to keep on operating, the failure would occur at some time after our data point (or to the right on the time scale). | |||
[[Image:right censoring.png|center|400px|Graphical representation of right censored data.]] | |||
=====Interval Censored Data===== | |||
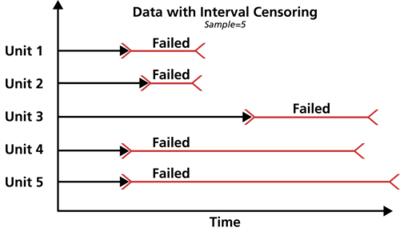
The second type of censoring is commonly called ''interval censored data''. Interval censored data reflects uncertainty as to the exact times the units failed within an interval. This type of data frequently comes from tests or situations where the objects of interest are not constantly monitored. For example, if we are running a test on five units and inspecting them every 100 hours, we only know that a unit failed or did not fail between inspections. Specifically, if we inspect a certain unit at 100 hours and find it operating, and then perform another inspection at 200 hours to find that the unit is no longer operating, then the only information we have is that the unit failed at some point in the interval between 100 and 200 hours. This type of censored data is also called ''inspection data'' by some authors. | |||
[[Image:interval censoring.png|center|400px|]] | |||
=====Left Censored Data===== | |||
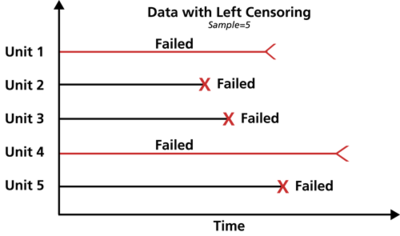
The third type of censoring is similar to the interval censoring and is called ''left censored data''. In left censored data, a failure time is only known to be before a certain time. For instance, we may know that a certain unit failed sometime before 100 hours but not exactly when. In other words, it could have failed any time between 0 and 100 hours. This is identical to ''interval censored data''in which the starting time for the interval is zero. | |||
[[Image:left censoring.png|center|400px|]] | |||
Revision as of 05:53, 23 July 2012
This article appears in the Accelerated Life Testing Data Analysis Reference book
Statistical models rely extensively on data to make predictions. In our case, the models are the statistical distributions and the data are the life data or times-to-failure data of our product. The accuracy of any prediction is directly proportional to the quality, accuracy and completeness of the supplied data. Good data, along with the appropriate model choice, usually results in good predictions. Bad, or insufficient data, will almost always result in bad predictions.
In the analysis of life data, we want to use all available data sets, which sometimes are incomplete or include uncertainty as to when a failure occurred. Life data can therefore be separated into two types: complete data (all information is available) or censored data (some of the information is missing). Each type is explained next.
Complete Data
Complete data means that the value of each sample unit is observed or known. For example, if we had to compute the average test score for a sample of ten students, complete data would consist of the known score for each student. Likewise in the case of life data analysis, our data set (if complete) would be composed of the times-to-failure of all units in our sample. For example, if we tested five units and they all failed (and their times-to-failure were recorded), we would then have complete information as to the time of each failure in the sample.

Censored Data
In many cases, all of the units in the sample may not have failed (i.e., the event of interest was not observed) or the exact times-to-failure of all the units are not known. This type of data is commonly called censored data. There are three types of possible censoring schemes, right censored (also called suspended data), interval censored and left censored.
Right Censored (Suspended) Data
The most common case of censoring is what is referred to as right censored data, or suspended data. In the case of life data, these data sets are composed of units that did not fail. For example, if we tested five units and only three had failed by the end of the test, we would have right censored data (or suspended data) for the two units that did not failed. The term right censored implies that the event of interest (i.e., the time-to-failure) is to the right of our data point. In other words, if the units were to keep on operating, the failure would occur at some time after our data point (or to the right on the time scale).

Interval Censored Data
The second type of censoring is commonly called interval censored data. Interval censored data reflects uncertainty as to the exact times the units failed within an interval. This type of data frequently comes from tests or situations where the objects of interest are not constantly monitored. For example, if we are running a test on five units and inspecting them every 100 hours, we only know that a unit failed or did not fail between inspections. Specifically, if we inspect a certain unit at 100 hours and find it operating, and then perform another inspection at 200 hours to find that the unit is no longer operating, then the only information we have is that the unit failed at some point in the interval between 100 and 200 hours. This type of censored data is also called inspection data by some authors.

Left Censored Data
The third type of censoring is similar to the interval censoring and is called left censored data. In left censored data, a failure time is only known to be before a certain time. For instance, we may know that a certain unit failed sometime before 100 hours but not exactly when. In other words, it could have failed any time between 0 and 100 hours. This is identical to interval censored datain which the starting time for the interval is zero.


