Template:Example:CD-GLL Weibull: Difference between revisions
Chuck Smith (talk | contribs) |
Chris Kahn (talk | contribs) |
||
| Line 18: | Line 18: | ||
<br> | <br> | ||
The stresses are transformed using an Arrhenius life-stress relationship for temperature, a Power Law life-stress | The stresses are transformed using an Arrhenius life-stress relationship for temperature, a Power Law life-stress relationship for voltage and the Weibull distribution as the underlying distribution. | ||
<br> | <br> | ||
<br> | <br> | ||
Revision as of 00:21, 3 May 2012
CD GLL-Weibull Example
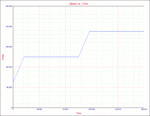
A sample of 18 units of an electronic component was subjected to temperature and voltage stresses. The temperature was initially set 100K and was then continuously increased to 200K over a period of 20 hours. The temperature was again increased at 120 hours to 300K over a 20 hours period as shown in the next figure.
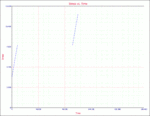
The voltage was initially set 4V and was then increased continuously to 8V over a period of 10 hours. The voltage was again increased at 110 hours to 12V over a 10 hours period as shown in the next figure.
The failure times, as entered in ALTA, are shown in the next figure.
The stresses are transformed using an Arrhenius life-stress relationship for temperature, a Power Law life-stress relationship for voltage and the Weibull distribution as the underlying distribution.
The estimated model parameters are shown next.
- [math]\displaystyle{ \begin{align} \widehat{\beta }=\ & 3.507277 \\ \widehat{{{\alpha }_{0}}}=\ & -1.377671 \\ \widehat{{{\alpha }_{1}}}=\ & 450.488282 \\ \widehat{{{\alpha }_{2}}}=\ & 1.981082 \end{align} }[/math]
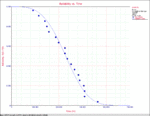
The use level (temperature = 100K, voltage = 4V) reliability plot is shown in the next figure.


