Stress-Strength Analysis in Design for Reliability: Difference between revisions
No edit summary |
No edit summary |
||
| Line 20: | Line 20: | ||
The above result shows that the current reliability is about 74.05%, which is below the target value of 90%. We need to use the '''Target Reliability Parameter Estimator''' to determine the parameters for the strength distribution that would be required to meet the target. Click the following icon: | The above result shows that the current reliability is about 74.05%, which is below the target value of 90%. We need to use the '''Target Reliability Parameter Estimator''' to determine the parameters for the strength distribution that would be required to meet the target. Click the following icon: | ||
[[Image:Stress-strength example 2 target R icon.png | [[Image:Stress-strength example 2 target R icon.png|center]] | ||
Revision as of 23:46, 25 April 2012
Using Stress-Strength Analysis to Determine the Required Strength Distribution
Assume the stress distribution for a component is known and it is a Weibull distribution with beta=3 and eta=2000. For the current design, the strength distribution is also a Weibull distribution with beta =1.5 and eta=4000.
- • Evaluate the current reliability.
- • If the reliability does not meet the target reliability of 90%, determine what parameters would be required for the strength distribution in order to meet the specified target.
Solution
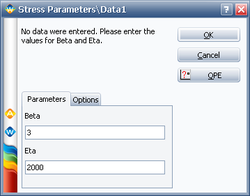
First, we need to create two empty Weibull++ standard folios and enter the distribution parameters for the stress and strength distributions. For example, for the stress distribution, it is:

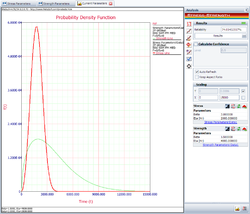
Then, we use the Stress-Strength tool to compare the two data sheets. The following figure shows the reliability of the current design:

The above result shows that the current reliability is about 74.05%, which is below the target value of 90%. We need to use the Target Reliability Parameter Estimator to determine the parameters for the strength distribution that would be required to meet the target. Click the following icon:

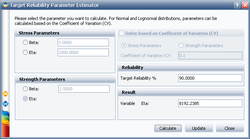
Choose to calculate for eta under Strength Parameters, set the Target Reliability to 90% and click Calculate:

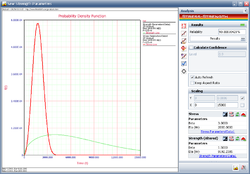
The calculated eta is 8192.2385 hours. Click Update to perform the stress-strength analysis again using the altered parameters for the strength distribution.
The plot shows the calculated reliability indeed is 90%.

Therefore, in order to meet the reliability requirement, the component must be redesigned with the eta to be at least 8192.2385 hours.