Proportional Hazards Medical Data Example: Difference between revisions
Nikki Helms (talk | contribs) Created page with '{| class="FCK__ShowTableBorders" border="0" cellspacing="0" cellpadding="0" align="center"; style="width:100%;" |- | valign="middle" align="left" bgcolor=EEEDF7|[[Image: ALTA-Exa…' |
Chris Kahn (talk | contribs) No edit summary |
||
| Line 1: | Line 1: | ||
{| class="FCK__ShowTableBorders" border="0" cellspacing="0" cellpadding="0" align="center"; style="width:100%;" | {| class="FCK__ShowTableBorders" border="0" cellspacing="0" cellpadding="0" align="center"; style="width:100%;" | ||
|- | |- | ||
| valign="middle" align="left" bgcolor=EEEDF7|[[Image: | | valign="middle" align="left" bgcolor=EEEDF7|[[Image: ALTA_Examples_Banner.png|400px|center]] | ||
|} | |} | ||
<br> | <br> | ||
Revision as of 10:16, 27 July 2012
 |
The Proportional Hazards model was developed in order to estimate the effects of different covariates influencing the times-to-failure of a system. One of the advantages of the Proportional Hazards model is that it can allow simultaneous analysis of continuous and categorical variables. The model has been widely used in the biomedical field. In this example we will use the Proportional Hazards to model the lifetime distribution of patients under different conditions.
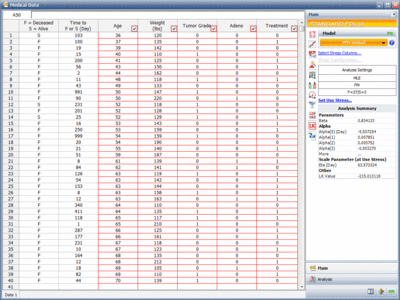
Consider the data obtained from 40 cancer patients as shown in the next figure.

The Proportional Hazards model is used to model the life distribution of these patients under eight conditions such as age and weight. Some of these conditions are described with values (e.g., Weight = 120 pounds), and some are described with indicator variables (e.g., Adeno = 1 if the cancer is an adenocarcinoma, otherwise Adeno = 0). Failure/suspension times are counted from the time of diagnosis.
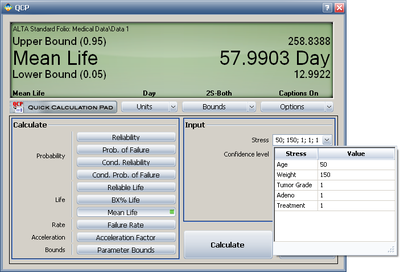
After the parameters of the model are calculated, we can solve for various metrics (e.g., mean life, or average time from diagnosis to death) given a specified set of conditions, as shown next.
