BlockSim Phase Simulation Plot Examples: Difference between revisions
Jump to navigation
Jump to search
Created page with '{{Oil Refinery}} ====Results Plots==== With simulation end time as 365 days (8760 hours) and 1000 simulations, next we will show some plots of the simulation results for this oi…' |
No edit summary |
||
| Line 1: | Line 1: | ||
{| class="FCK__ShowTableBorders" border="0" cellspacing="0" cellpadding="0" align="center"; style="width:100%;" | |||
|- | |||
| valign="middle" align="left" bgcolor=EEEDF7|[[Image: BlockSim-Examples-banner.png|400px|center]] | |||
|} | |||
{{Oil Refinery}} | {{Oil Refinery}} | ||
Revision as of 21:10, 21 March 2012
Template loop detected: Template:Oil Refinery
Results Plots
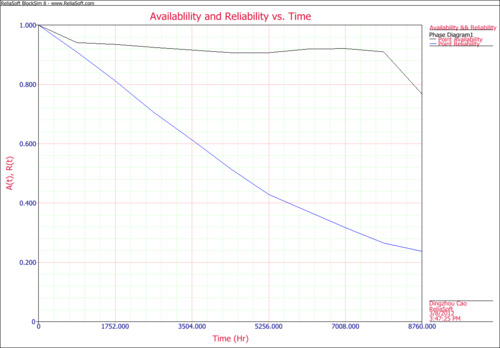
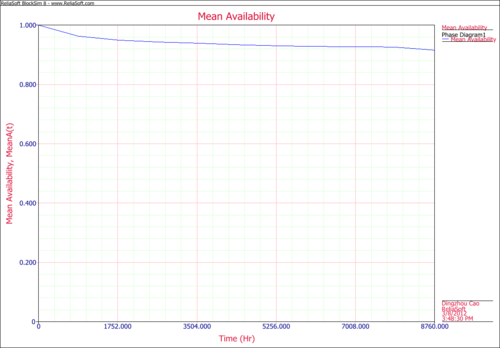
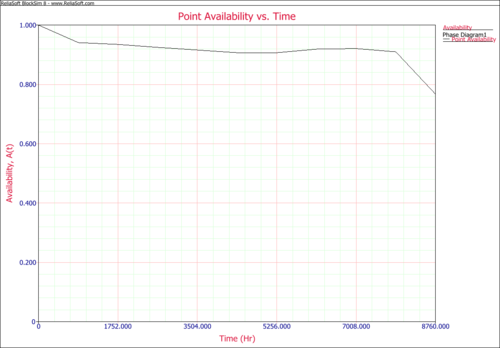
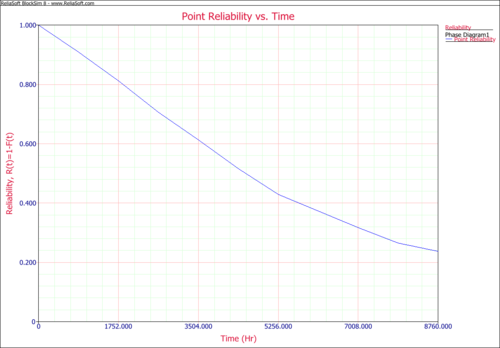
With simulation end time as 365 days (8760 hours) and 1000 simulations, next we will show some plots of the simulation results for this oil refinery example.
Availability and Reliability vs. Time
Mean Availability
Point Availability
Point Reliability
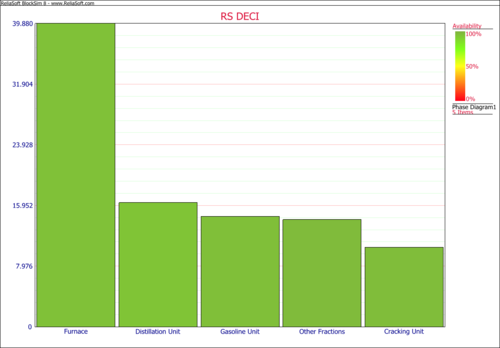
RS DECI
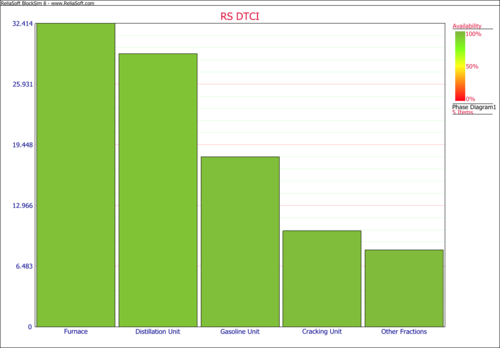
RS DTCI
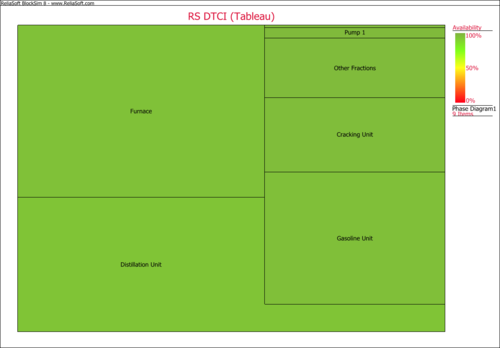
RS DTCI(Tableau)
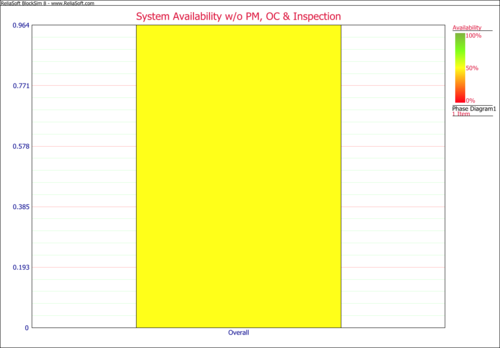
System Availability
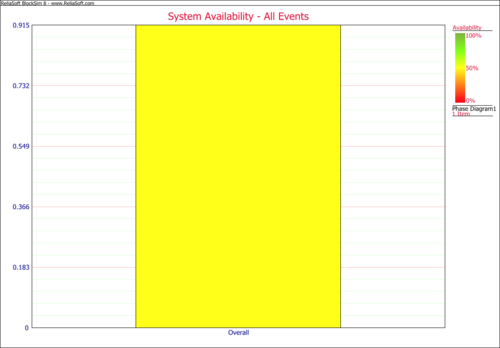
System Availability - All Events
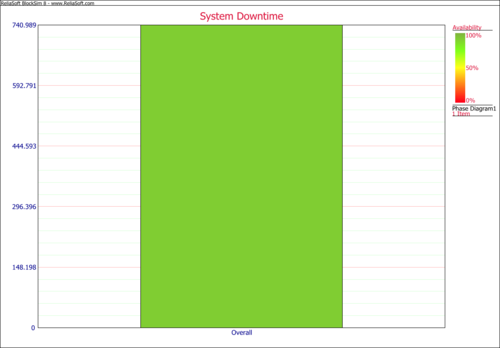
System Down Time
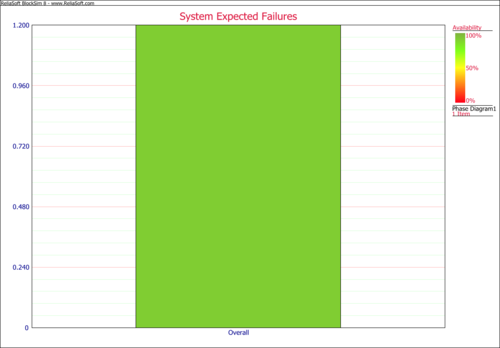
System Expected Failues
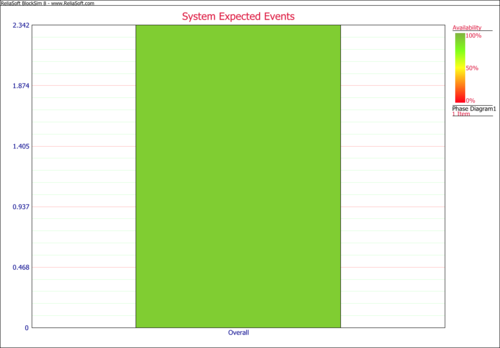
System Expected Downing Events
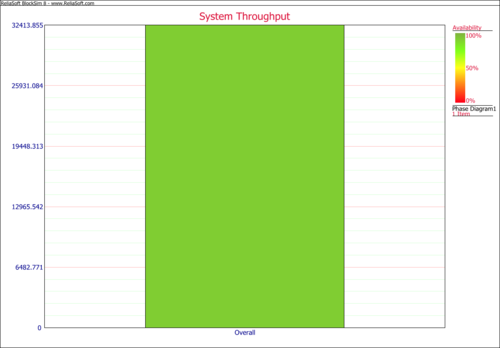
System Throughput
Results Plots
With simulation end time as 365 days (8760 hours) and 1000 simulations, next we will show some plots of the simulation results for this oil refinery example.
Availability and Reliability vs. Time

Mean Availability

Point Availability

Point Reliability

RS DECI

RS DTCI

RS DTCI(Tableau)

System Availability

System Availability - All Events

System Down Time

System Expected Failues

System Expected Downing Events

System Throughput
