3-Parameter Weibull Example: Difference between revisions
Created page with ''''Three-parameter Weibull distribution example''' Six identical units are reliability tested under the same stresses and conditions. All units are tested to failure and the fol…' |
No edit summary |
||
| Line 1: | Line 1: | ||
{| class="FCK__ShowTableBorders" border="0" cellspacing="0" cellpadding="0" align="center"; style="width:100%;" | |||
|- | |||
| valign="middle" align="left" bgcolor=EEEDF7|[[Image:Weibull-Examples-banner.png|500px|center]] | |||
|} | |||
'''Three-parameter Weibull distribution example''' | '''Three-parameter Weibull distribution example''' | ||
Revision as of 17:54, 21 March 2012
 |
Three-parameter Weibull distribution example
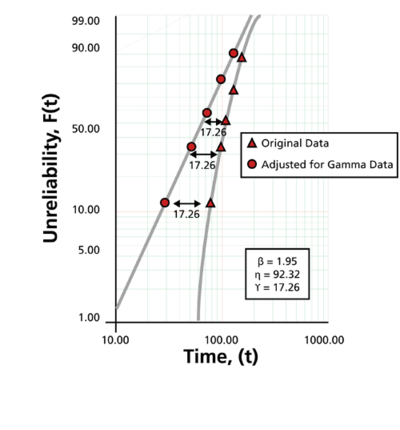
Six identical units are reliability tested under the same stresses and conditions. All units are tested to failure and the following times-to-failure are recorded: 48, 66, 85, 107, 125 and 152 hours. Find the parameters of the three-parameter Weibull distribution using probability plotting.
Solution
The following figure shows the results. Note that since the original data set was concave down, 17.26 was subtracted from all the times-to-failure and replotted, resulting in a straight line, thus γ = 17.26. (We used Weibull++ to get the results. To perform this by hand, one would attempt different values of γ, using a trial and error methodology, until an acceptable straight line is found. When performed manually, you do not expect decimal accuracy.)
